Bitcoin (BTC) Price Prediction: BTC May Be Preparing to Break the $65,000 Resistance
Estimated Reading Time: 3 minutes
Don’t invest unless you’re prepared to lose all the money you invest. This is a high-risk investment and you are unlikely to be protected if something goes wrong. Take 2 minutes to learn more

Bitcoin (BTC) Price Prediction – May 15
Bitcoin’s price action has seen considerable movement today as its price continues to close in on a medium-term resistance. In fact, the market can be considered preparing to break the $65,000 mark. There are also indications that price action may have acquired the needed momentum to achieve the desired goal.
BTC/USDT Long-term Trend: Bullish (Daily Chart)
Key Levels
Resistance Levels: $65,000, $70,000, and $75,000
Support Levels: $60,000, $55,000, and $50,000
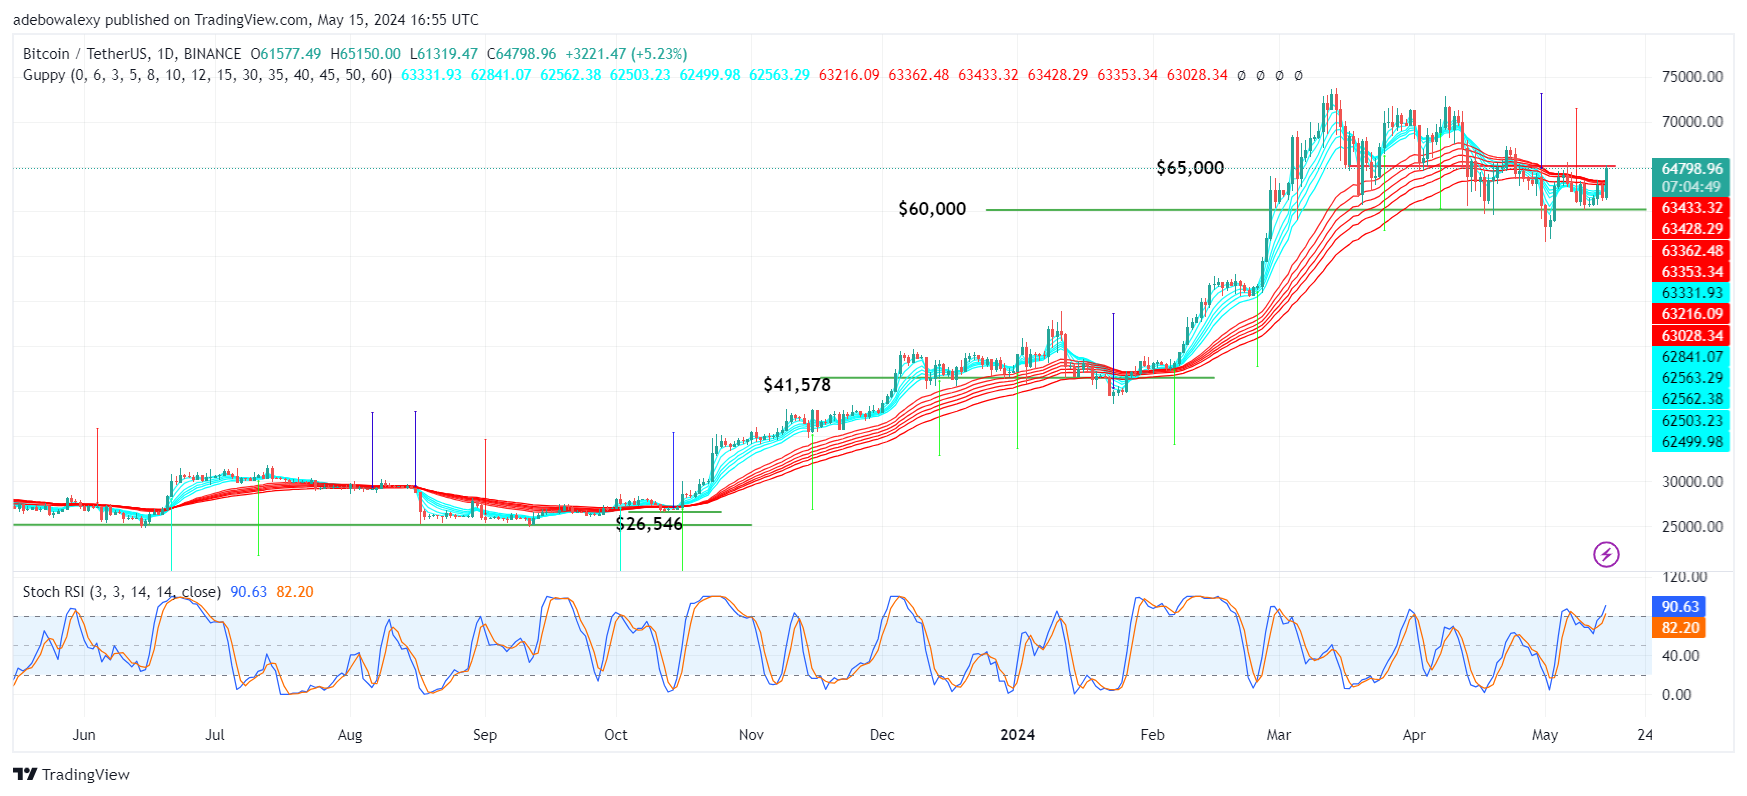
The current price candle has grown significantly during today’s session, placing the BTC price above the crossed Guppy Multiple Moving Average (GMMA) lines. Likewise, the Stochastic Relative Strength Index (SRSI) lines are trending upward. The indicator lines had previously approached a trend reversal move. However, the more recent part of the indicator lines has averted that, and the lines of this indicator is now rising upward, indicating renewed upside momentum. This further affirms the strength of the bulls in this session.
Bitcoin Price Prediction: Will Bitcoin Break Below the $65,000 Mark?
The last price candle on this chart has grown past the GMMA indicator lines, appearing green. Also, the GMMA indicator lines can be seen crossing each other below the current price of BTC. At this point, the market is on the verge of breaking through the resistance at the $65,000 mark, with the token now trading at the $64,800 mark.
The SRSI indicator lines are now in the overbought region. The fact that the lines of this indicator are still pointing steeply upwards in this region suggests that the current trend of this market may still have the needed momentum to push through the $65,000 resistance. Traders can only wait and see how this will unfold.
BTC/USDT Medium-term Trend: Bitcoin Stays on a Bullish Path (4H Chart)
Looking at the 4-hour BTC market, we can see that price action seems determined to stay on a bullish path. While the previous session ended under the control of buyers with significant gains recorded, the ongoing session has started on the same trajectory. The last price candle here was formed clearly above the GMMA lines, and the SRSI indicator lines maintained an upside trajectory.
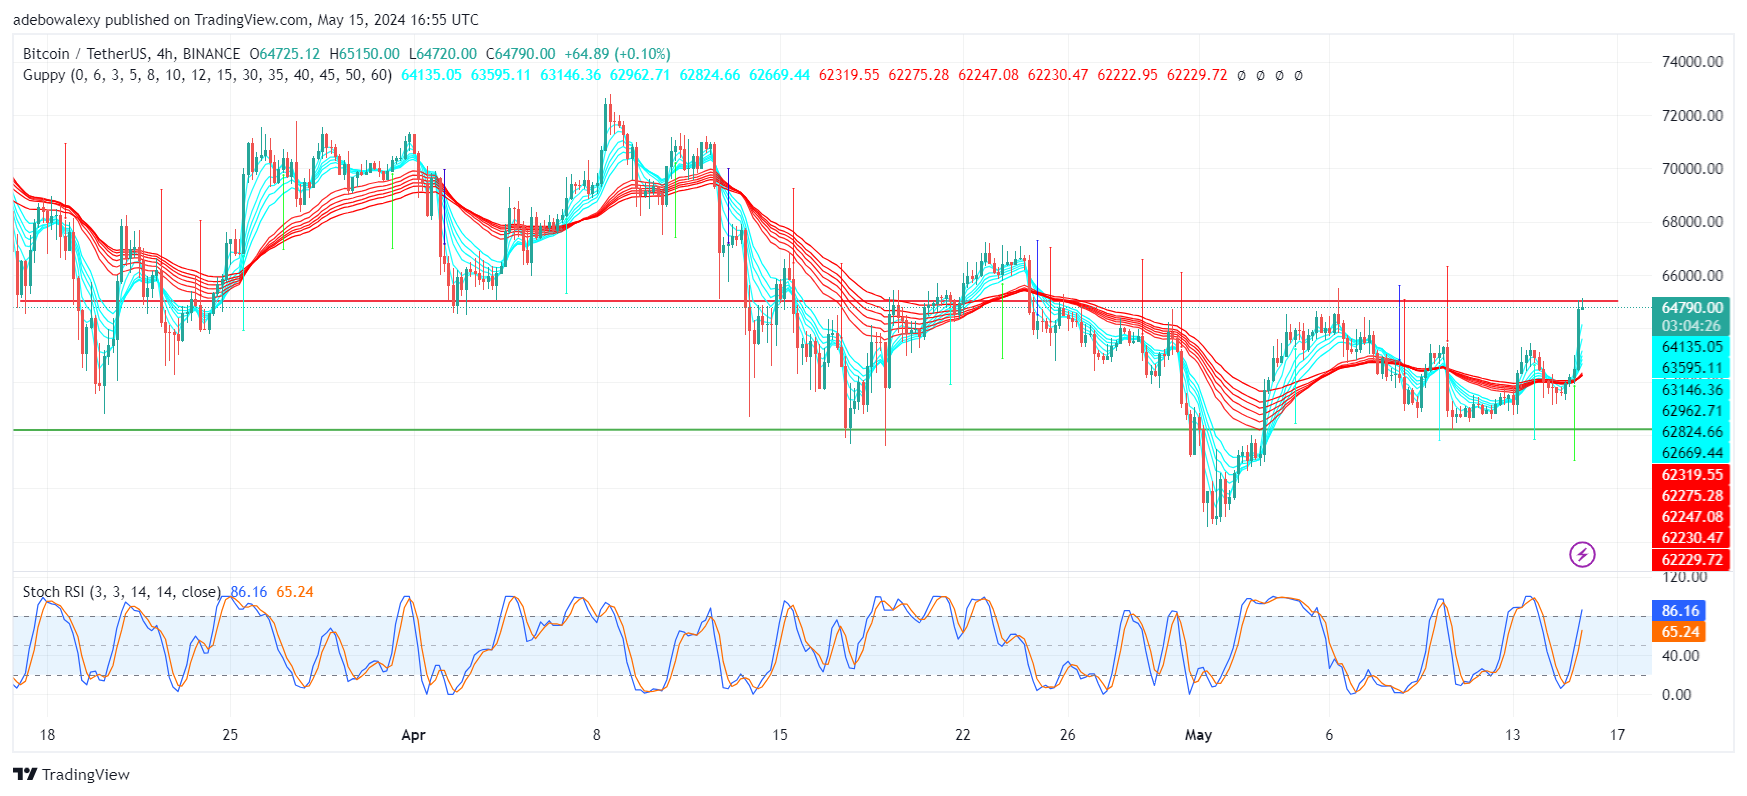
The leading line of this indicator is now above the 80 mark, while the lagging one is still below the 70 mark. Consequently, this indicates that price volatility in this market is healthy. However, the last price candle here can be seen testing the $65,000 mark with its upper shadow. Considering the prevalent trend in the market, traders can anticipate that the market will hit the $67,000 mark.