Bitcoin Cash (BCH/USD) Swings in Ranges Close to $500
Estimated Reading Time: 3 minutes
Don’t invest unless you’re prepared to lose all the money you invest. This is a high-risk investment and you are unlikely to be protected if something goes wrong. Take 2 minutes to learn more
Bitcoin Cash Price Prediction – July 23
The BCH/USD financial book of records now has it that the crypto economy swings in ranges close to the level of $500 to trade at $445 as of writing. The market witnesses a lighter positive percentage rate of 0.81.
BCH/USD Market
Key Levels:
Resistance levels: $600, $800, $1,000
Support levels: $400, $300, $200
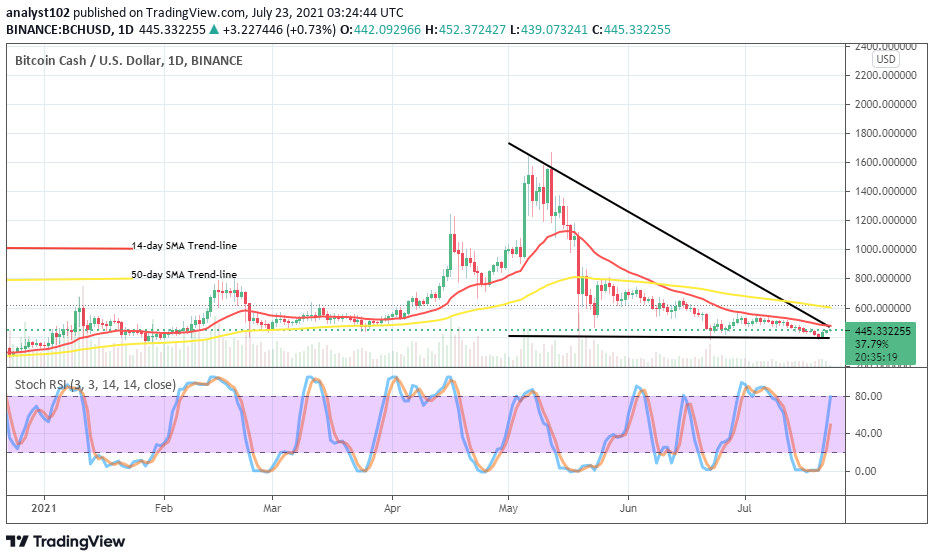
BCH/USD – Daily Chart
The BCH/USD daily chart reveals that the crypto trade swings in ranges close to $500 around where the smaller SMA launches a resistant positioning. The 50-day SMA indicator is above the 14-day SMA indicator as the bearish trend-line drew downward across the bigger SMA to back the smaller SMA at the resistant placement point. The Stochastic Oscillators have swerved the lines from the oversold region to touch the range of 80. That is an indication that the crypto market is on a slight-moving recovery.
Will BCH/USD market not be reversed shortly as price swings in ranges close to $500?
On the July 20th session, the BCH/USD dropped to touch the lower support point at $400. The following days’ sessions now witness that the crypto swings in ranges close to the mid-value of $500 as the upper range line is at $600. Bulls may now have to pause for a while to build up strength around the mid-point of the range trading zones before they can continue pushing to the upside of the crypto economy.
On the downside of technical analysis, the BCH/USD bears needed to make a stronghold of the market between the mid and upper range points against any move that is capable of breaking out of the range-bound trading zones. A slow and steady motion to the north may lead to long-support finding trading situations. Therefore, if it were to be that, bears will have to be on the lookout for a decent entry around the upper range value at $600.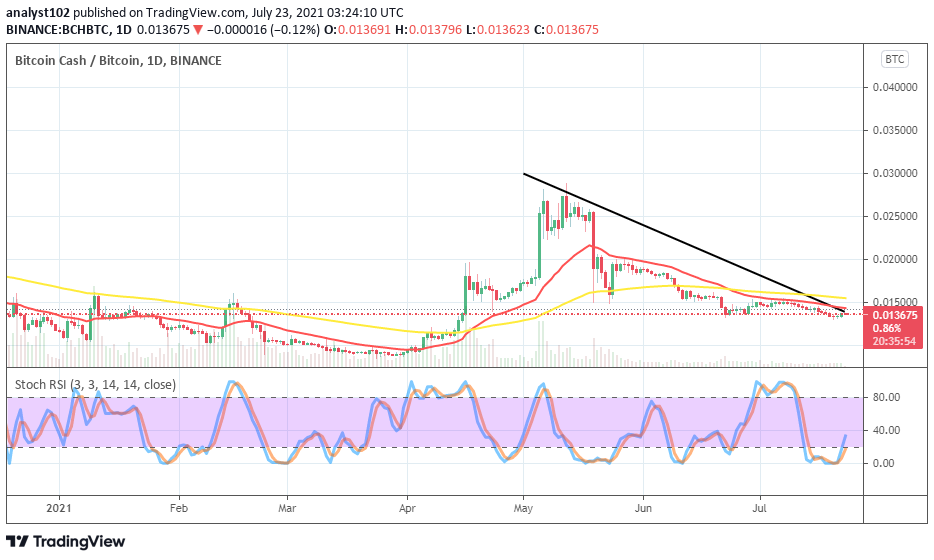
BCH/BTC Price Analysis
In comparison, the trending measure between Bitcoin Cash and Bitcoin appears that the base crypto’s valuation only swings in ranges close to the trend-line of smaller SMA. The 14-day SMA indicator is underneath the 50-day SMA indicator as the bearish trend-line drawn southward across the bigger SMA to conjoin with the smaller SMA at the extreme edge line. The Stochastic Oscillators have crossed the lines northbound closely to the range of 40, indicating that the base crypto is settling a baseline to launch an upward move pairing with the most valuable counter trading instrument.
You can purchase crypto coins here. Buy Tokens