Rocket Pool (RPL/USD) Bulls Battle to Maintain $20 Support
Estimated Reading Time: 3 minutes
Don’t invest unless you’re prepared to lose all the money you invest. This is a high-risk investment and you are unlikely to be protected if something goes wrong. Take 2 minutes to learn more
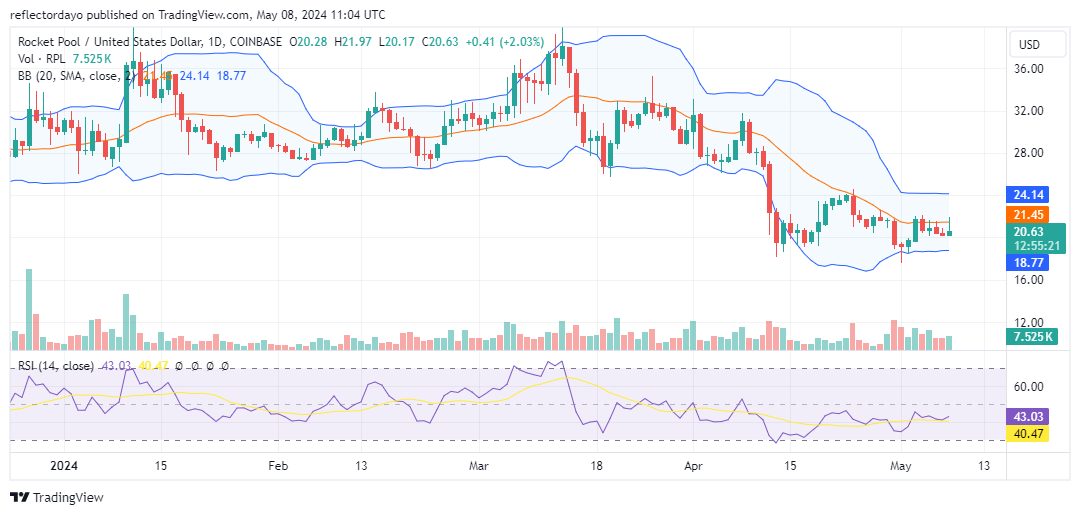
With a modest gain of 0.86% in today’s Rocket Pool trading activities, it represents the bulls’ attempt to maintain their position at the $20.00 support level amidst bearish pressure. The bearish momentum was initiated on March 13th, reaching its peak at $42.5 as the bullish trend exhausted and succumbed to the bearish market. Subsequently, the bear market gathered further momentum upon breaching the support level at $28.00. The breach of the critical $28.00 support level precipitated a surge in bearish sentiment, rapidly driving the market downward. However, the bulls began to intervene around the $20.00 mark, effectively stalling the prevailing bearish market trend.
Rocket Pool Market Data
- RPL/USD Price Now: $20.47
- RPL/USD Market Cap: $5.4 million
- RPL/USD Circulating Supply: 20.3 million
- RPL/USD Total Supply: 20.3 million
- RPL/USD CoinMarketCap Ranking: #153
Key Levels
- Resistance: $24.00, $25.00, and $28.00
- Support: $20.00, $18.00, and $17.00.
Rocket Pool Through the Lens of Indicators
Despite the bullish traders’ tentative entrance at the $20.00 price level, they are resiliently holding their ground against the prevailing bear market sentiment. While their presence is evident, the influence of the bearish trend remains palpable. It is imperative for the bulls to secure dominance over the $20.00 price level. Nonetheless, failure at this juncture may find support in the $20 to $17 range, historically favorable for bullish reversals.
Today’s candlestick pattern indicates continued bullish dominance; however, a temporary setback occurred as bears momentarily resisted the upward price movement, forming an inverted hammer pattern. Paradoxically, this inverted hammer signals a potential strengthening of bullish momentum. Meanwhile, amidst the crypto signal pointing to the volatility of the bear market, the Bollinger Bands indicator, with its two bands and the 20-day moving average, continues to reflect a market in consolidation.
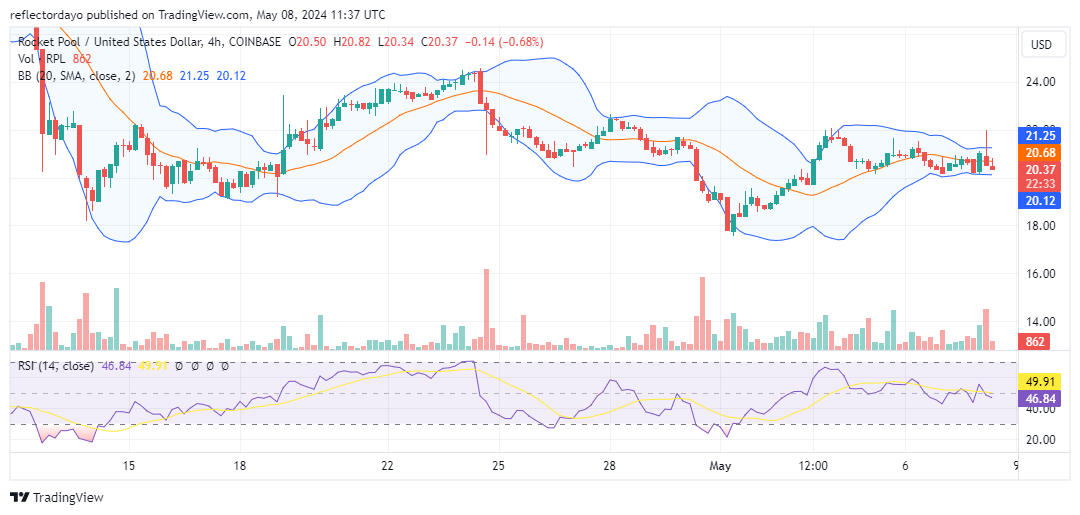
RPL/USD Price Prediction: 4-Hour Chart Analysis
From the perspective of the 4-hour chart in the Rocket Pool market, despite significant rapid price swings, the Bollinger Bands indicator is indicating signs of a volatility squeeze. This suggests that Rocket Pool investors should prepare for a pronounced price movement in a discernible direction. Currently, market activity has dipped below the 20-day moving average. While this could potentially signify a breakdown, the bullish zone remains centered around $20, with slight variation. It’s plausible that the price may experience a rebound upon reaching this $20 threshold.