Render Token (RNDR/USD) Shows Significant Price Surge, Approaching $12.00 Mark
Estimated Reading Time: 3 minutes
Don’t invest unless you’re prepared to lose all the money you invest. This is a high-risk investment and you are unlikely to be protected if something goes wrong. Take 2 minutes to learn more
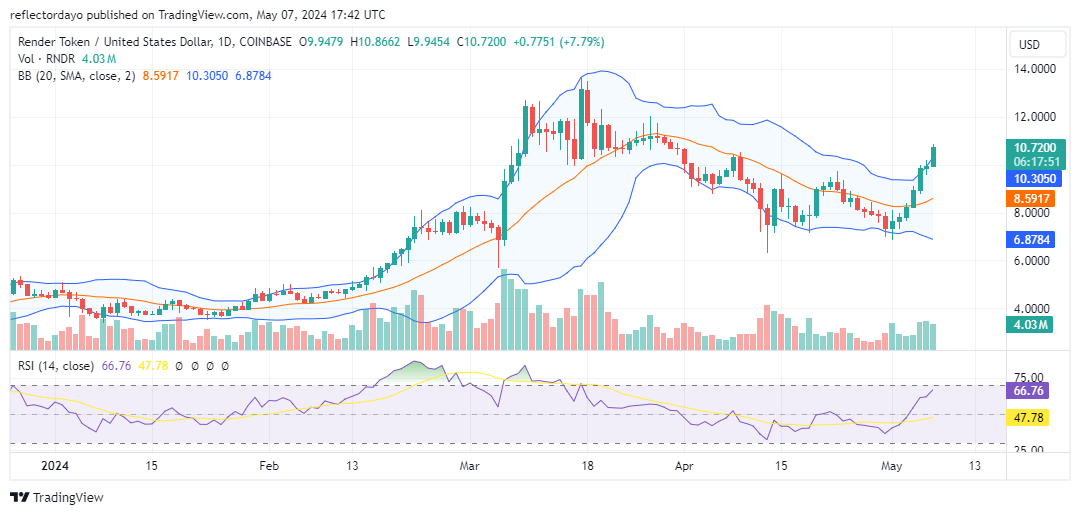
The Render Token market is currently indicating a robust sell signal, as it has recently surged beyond a crucial support level of $10.00. This breach of significant resistance could incentivize additional traders to adopt long positions. Nevertheless, it’s essential to remain vigilant for potential bearish sentiment, as this notable bullish momentum may trigger renewed bearish activity around key resistance points, notably at the $11.00 and $12.00 price levels.
Render Token Market Data
- RNDR/USD Price Now: $10.74
- RNDR/USD Market Cap: $4.2 billion
- RNDR/USD Circulating Supply: 388 million
- RNDR/USD Total Supply: 536 million
- RNDR/USD CoinMarketCap Ranking: #24
Key Levels
- Resistance: $11.00, $12.00, and $13.00
- Support: $9.00, $8.00, and $7.00.
Render Token Through the Lens of Indicators
Considering the indicators, the initial crypto signal is hinting at a potential emergence of bearish sentiment, as may be observed from the Bollinger Bands indicator. Notably, the price action has surged beyond the upper Bollinger Bands, indicating robust buying pressure that likely positions the market in overbought territory. Conversely, the Relative Strength Indicator (RSI) presents mixed signals, suggesting a possibility for further bullish activities, albeit marginally, with the current bull market momentum measured at 66.
This RSI indication implies that the market remains proximate to overbought conditions. Traders should remain cautious, particularly around the $11.00 and $12.00 price levels. However, if these levels prove resistant, an established support level above $10.00 would bolster the bull market’s future trajectory, potentially propelling it further upwards.
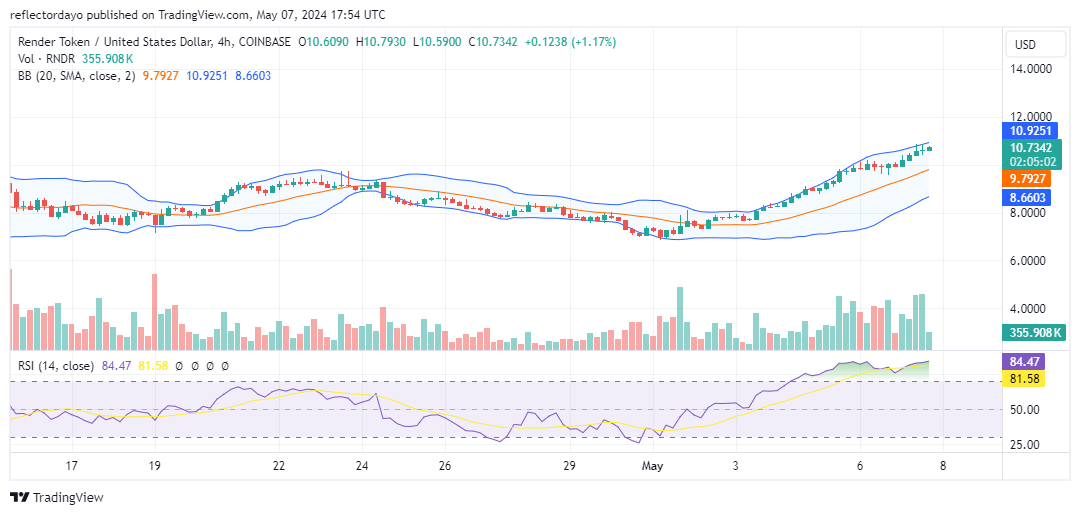
RNDR/USD Price Prediction: 4-Hour Chart Analysis
In a shorter timeframe, such as the 4-hour chart, the Relative Strength Index (RSI) indicates an overbought market condition. Consequently, the bullish momentum is showing signs of deceleration, potentially paving the way for bearish momentum to emerge around the $11.00 price threshold. Should bullish traders maintain their position at the $10.00 price level, they may gather adequate strength to surpass both the $11.00 and $12.00 levels in due course.