Solana (SOL/USD) Squeezed in Rectangle, Bulls Eye Breakout
Estimated Reading Time: 3 minutes
Don’t invest unless you’re prepared to lose all the money you invest. This is a high-risk investment and you are unlikely to be protected if something goes wrong. Take 2 minutes to learn more
Solana (SOL/USD) experienced a significant sell-off that drove the price down to a low of approximately $127. Bulls emerged at this support level, prompting a rebound. Strong buying pressure is evident around the $120 price point, which now acts as a key support level. The $160 level, previously breached on April 23rd, now presents resistance as bulls attempt to recapture lost ground. Today’s trading session indicates another test of this resistance level.
Solana Market Data
- SOL/USD Price Now: $151
- SOL/USD Market Cap: $68 billion
- SOL/USD Circulating Supply: 447 million
- SOL/USD Total Supply: 573 million
- SOL/USD CoinMarketCap Ranking: #5
Key Levels
- Resistance: $160, $170, and $180
- Support: $140, $135, and $130.
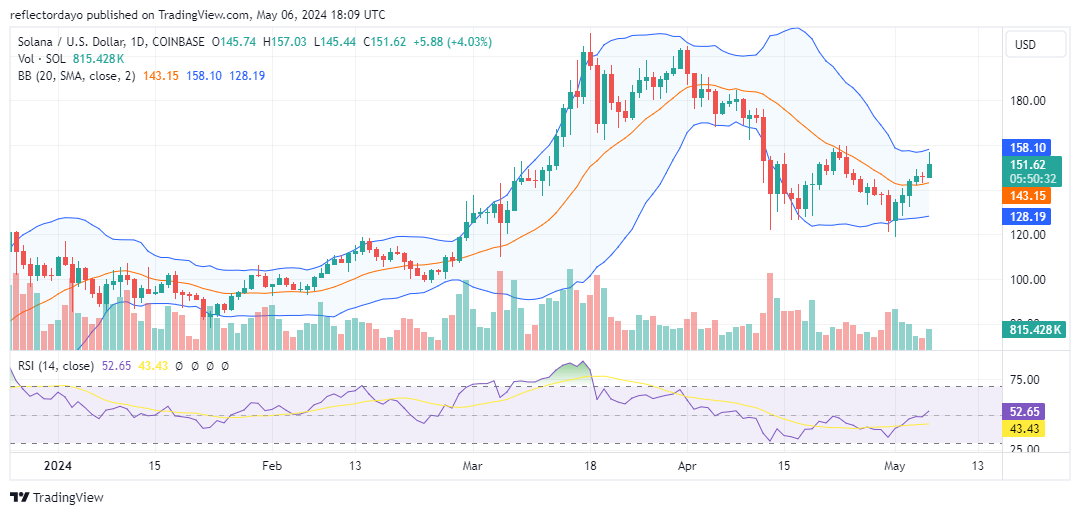
Solana Through the Lens of Indicators
Solana (SOL/USD) approaches the critical $160 resistance level. Today’s candlestick exhibits a long upper shadow, indicating potential selling pressure at this point. However, the price remains above the 20-day moving average, suggesting, according to this crypto signal, ongoing bullish control. While the current setup lacks a strong buy signal due to the upper shadow, shorter timeframes (5-day and 10-day moving averages) might suggest a sell signal if the price dips below those MAs.
On a more positive note, the Bollinger Bands are contracting, hinting at a potential price squeeze and possible volatility. Additionally, the RSI is diverging from its midpoint at 50 to around 52, indicating a shift in momentum that could favor the bulls. Ultimately, a sustained break above $160 is needed to confirm a bullish breakout from this resistance level.
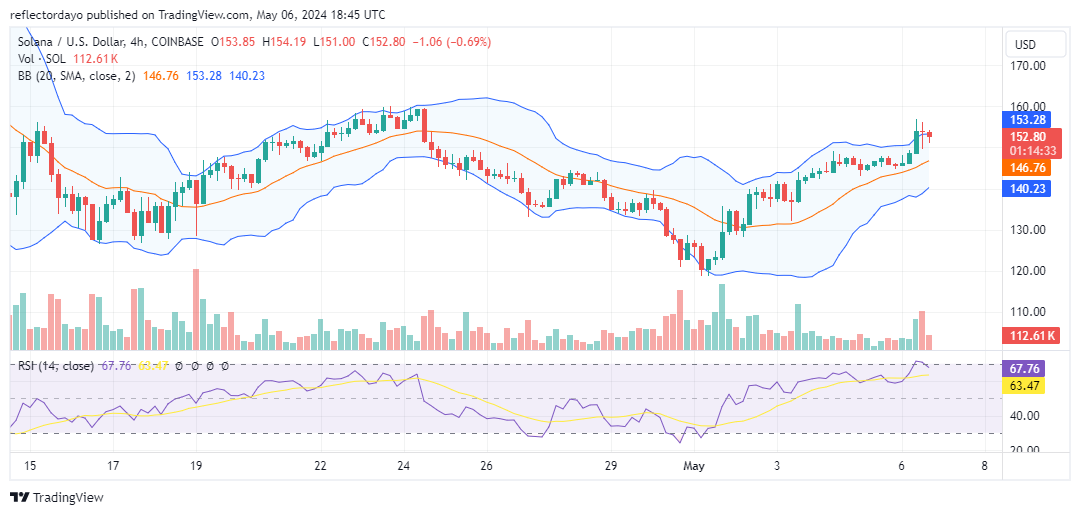
SOL/USD Price Prediction: 4-Hour Chart Analysis
The 4-hour chart reveals upward-sloping Bollinger bands, suggesting potential volatility. Price currently faces resistance around $153. This area between $153 and $160 could act as a potential take-profit zone for short-term traders. However, if bullish momentum persists and bulls find themselves evenly matched with bears at $160, consolidation may occur. A sustained break above this key resistance level would then be crucial for a confirmed bullish breakout.