Hedera Hashgraph (HBAR/USD) Retraces the $0.15 Price Level
Estimated Reading Time: 3 minutes
Don’t invest unless you’re prepared to lose all the money you invest. This is a high-risk investment and you are unlikely to be protected if something goes wrong. Take 2 minutes to learn more
In late April, the Hedera Hashgraph market experienced a notable surge in upward momentum. Between April 23 and April 24, the market reached a peak of $0.18. The significant bullish activity during this period led to substantial profit-taking, resulting in a sharp decline in price. However, bulls swiftly capitalized on the $0.1 price level, which had previously served as a crucial support level from February through early April. Currently, the price of Hedera Hashgraph is trending upward from this level and may potentially retrace back to $0.15.
Hedera Hashgraph Market Data
- HBAR/USD Price Now: $0.12
- HBAR/USD Market Cap: $4.3 million
- HBAR/USD Circulating Supply: 35.7 billion
- HBAR/USD Total Supply: 50 billion
- HBAR/USD CoinMarketCap Ranking: #24
Key Levels
- Resistance: $0.13, $0.14, and $0.15
- Support: $0.10, $0.09, and $0.085
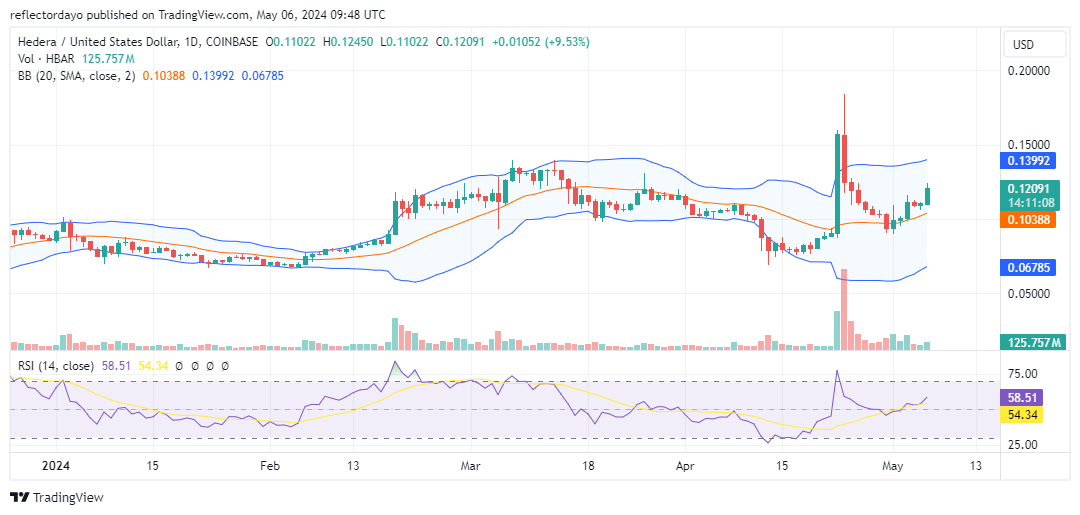
Hedera Hashgraph Through the Lens of Indicators
The upward movement of the Bollinger bands is initiated by the swift intervention of bulls, who actively maintain their position at $0.10, consequently keeping the price above the 20-day moving average. This dynamic prompts the Bollinger indicator to depict an ascending price channel. Additionally, the Relative Strength Index (RSI) confirms this trend, illustrating ascending market momentum with its RSI line at 58. However, despite the rising price, the presence of a small upper shadow on today’s bullish candlestick, reflecting today’s trading activities, suggests signs of bearish pressure in the current market environment.
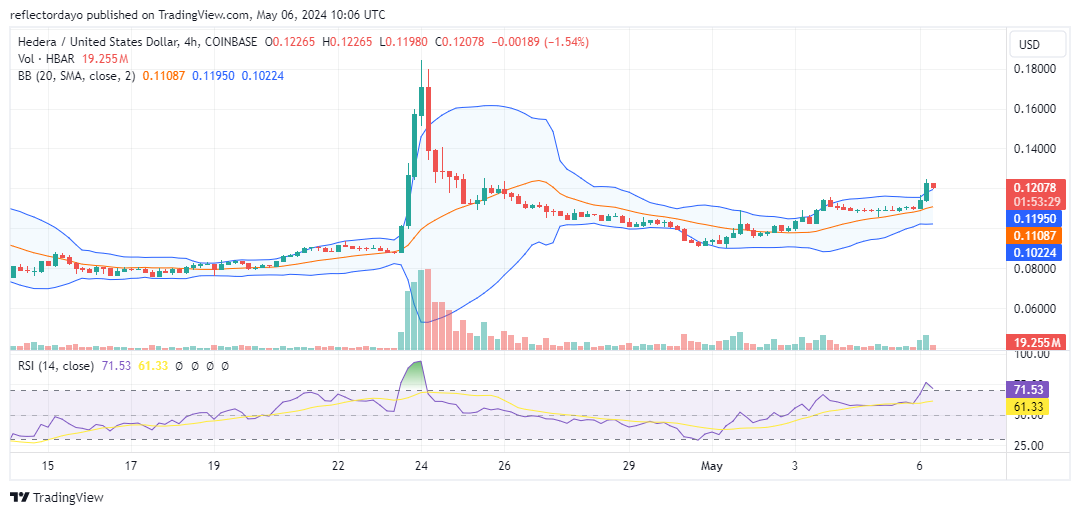
HBAR/USD Price Prediction: 4-Hour Chart Analysis
While the daily chart indicates an upward price trend within a narrower bandwidth (the difference between the support and resistance levels), it’s worth noting that the bandwidth is more compressed, albeit still ascending. Additionally, the price action has moved outside the Bollinger Bands, suggesting a potential overbought condition in the market. According to this crypto signal, the recent price pullback could be interpreted as an attempt to correct the price action back within the bands. Despite this, there’s a strong likelihood that the prevailing market sentiment remains bullish, indicating the potential for sustained movement towards the critical $0.15 price level.