Bancor (BNTUSD) Keeps Ranging Between Key Levels
Estimated Reading Time: 2 minutes
Don’t invest unless you’re prepared to lose all the money you invest. This is a high-risk investment and you are unlikely to be protected if something goes wrong. Take 2 minutes to learn more

Free Crypto Signals Channel
Bancor Keeps a Sideways Movement Between Major Zones
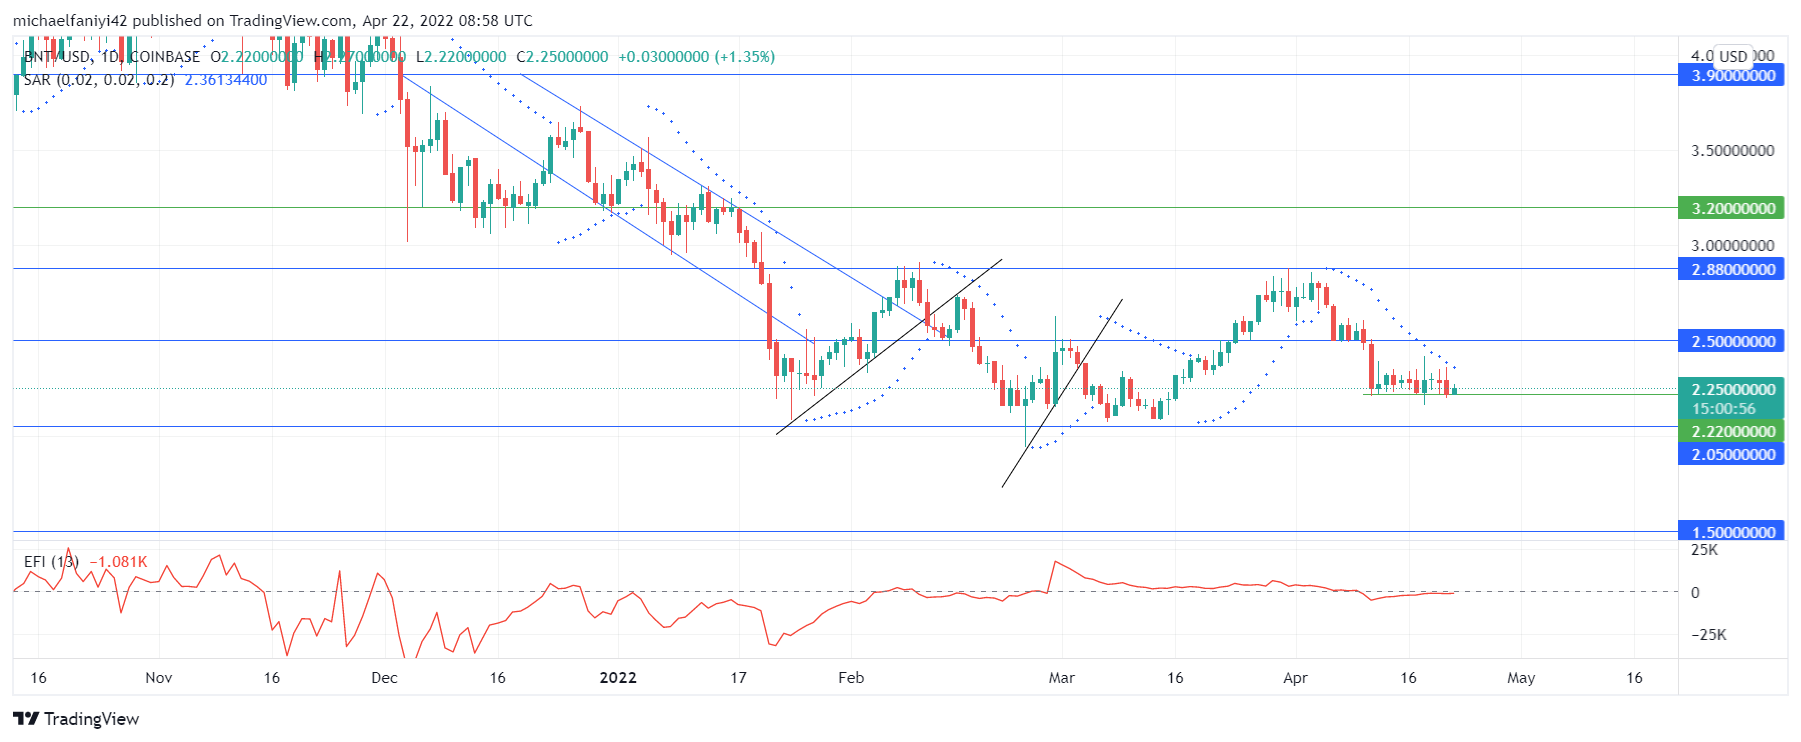
Bancor keeps ranging between key levels. On the 24th of February, the market dropped to the support level of $2.050 for the second time. An initial attempt to reach the supply level at $2.880 was rebuffed at $2.500. This led to another fall back to the demand zone on the 7th of March, giving rise to a double bottom pattern. As a result, Bancor was able to push higher toward the supply level of $2.880.
Bancor Significant Levels
Supply Levels: $2.500, $2.880, $3.200
Demand Levels: $1.500, $2.050, $2.220
The market finally lost fervour for an outright downward movement when it dropped to $2.050, a significant demand zone. The price immediately drove higher, bypassing every barrier to reach $2.880. However, the cycle continues as the price falls to the support level again, the second time. There was more resistance to the market’s rise the second time, but it eventually went through with a double bottom formation.
Having reached the $2.880 resistance, the price keeps up the ranging cycle by dropping towards the demand level again. The market has been trading at a mid-level between $2.500 and $2.050 for more than one week. This points to the bullish potential in the market. The EFI (Elders Force Index) indicator shows a strengthening of the buyers as the power line keeps rising.

Market Expectations
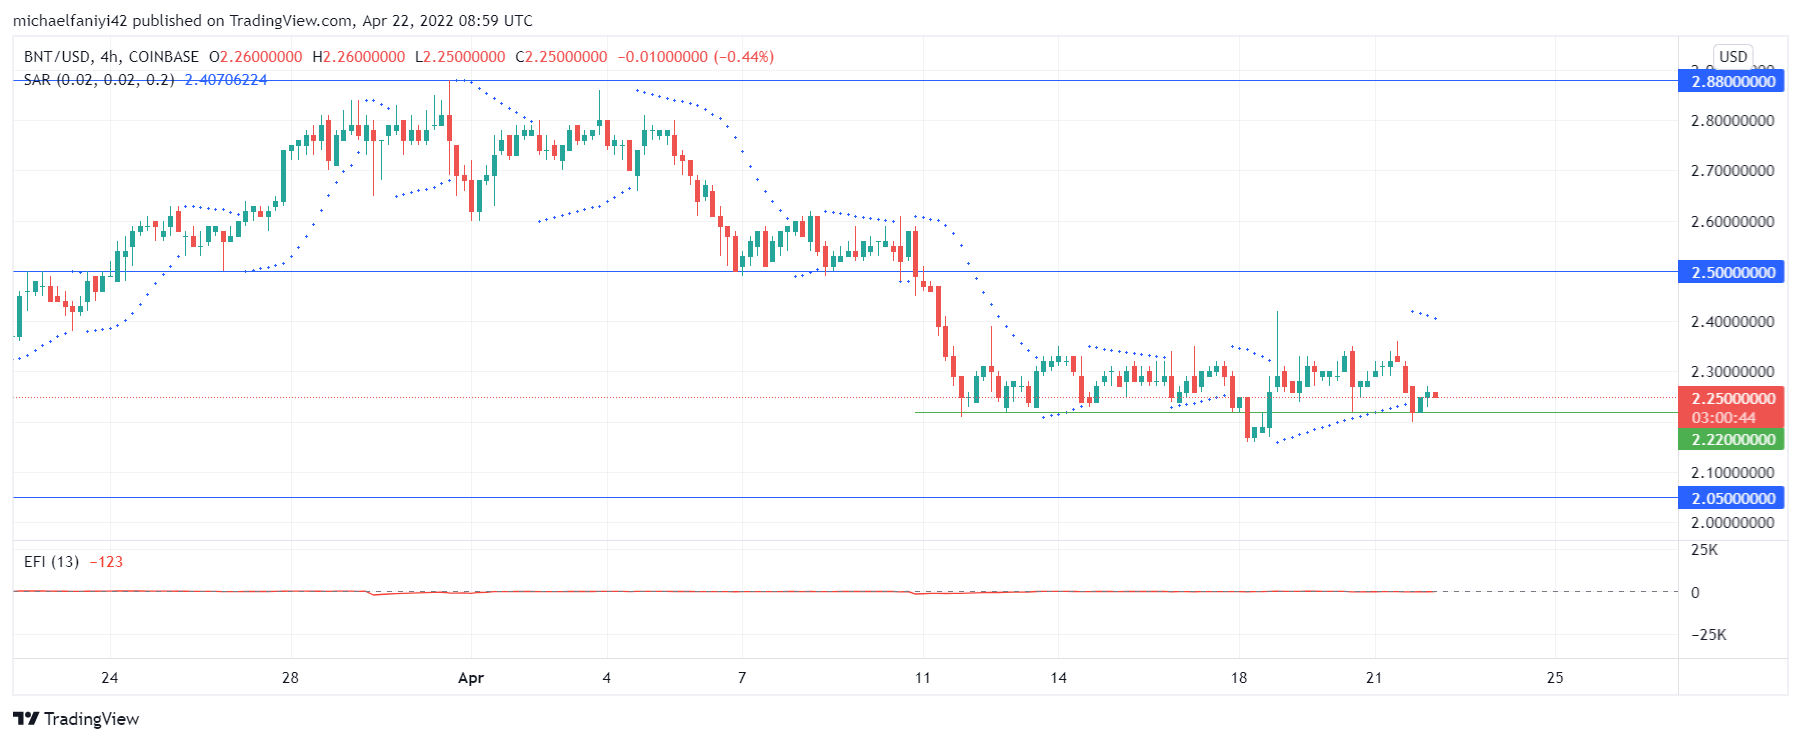
Within its wider consolidation range, the 4-hour chart clearly shows that the market is now reacting above the $2.220 critical level. This is equally represented by the EFI indicator, whose power line is undulating about the zero level. The Parabolic SAR (Stop and Reverse) is also seen alternating its dots around the 4-hour candles. The market is expected to take a strong upsurge either from this level or after it finally drops to $2.050.
How To Buy Lucky Block
Note: Cryptosignals.org is not a financial advisor. Do your research before investing your funds in any financial asset or presented product or event. We are not responsible for your investing results.