Binance Coin Reaches Bearish Exhaustion, Holds Above $420 Support
Estimated Reading Time: 2 minutes
Don’t invest unless you’re prepared to lose all the money you invest. This is a high-risk investment and you are unlikely to be protected if something goes wrong. Take 2 minutes to learn more

Binance Coin (BNB) Long-Term Analysis: Bearish
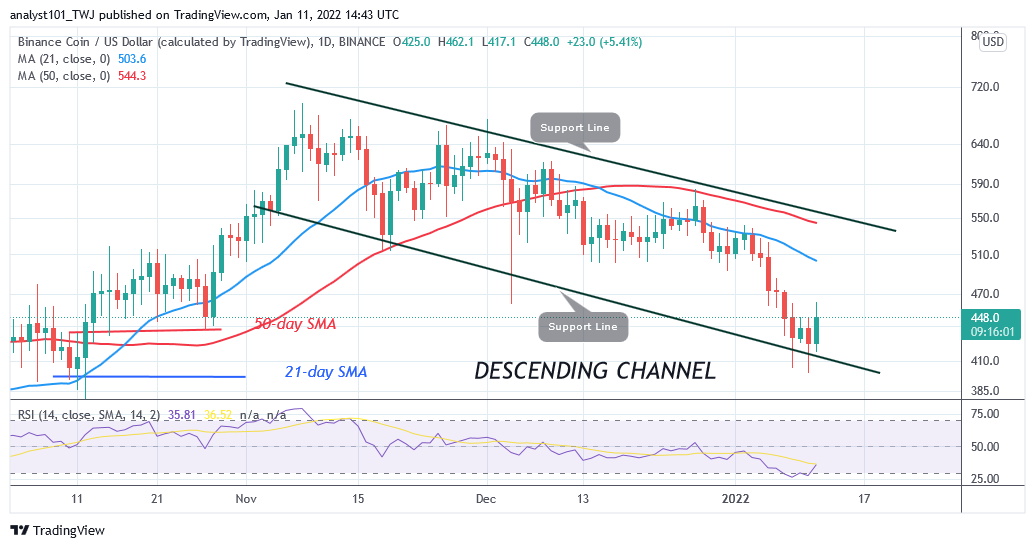
Binance Coin’s (BNB) price is in a downward correction as it holds above $420 support. During December 4 price slump, BNB price corrected upward and commenced a range-bound move between $520 and $600. The range-bound move lasted for a month before the $500 support was breached. The market decline to $399 low as bulls bought the dips. BNB fell to an oversold region of the market. Therefore, the altcoin is resuming upward. The uptrend will resume if the current holds.
Binance Coin (BNB) Indicator Analysis
BNB is at level 26 of the Relative Strength Index period 14. The market has reached the oversold region. The altcoin is rising upward as buyers emerge in the oversold region. The crypto’s price bars are still below the moving averages which makes the altcoin fall. BNB is below the 20% range of the daily stochastic. It also indicates that BNB has reached the oversold region.
Technical indicators:
Major Resistance Levels – $640, $660, $680
Major Support Levels – $540, $520, $500
What Is the Next Direction for Binance Coin (BNB)?
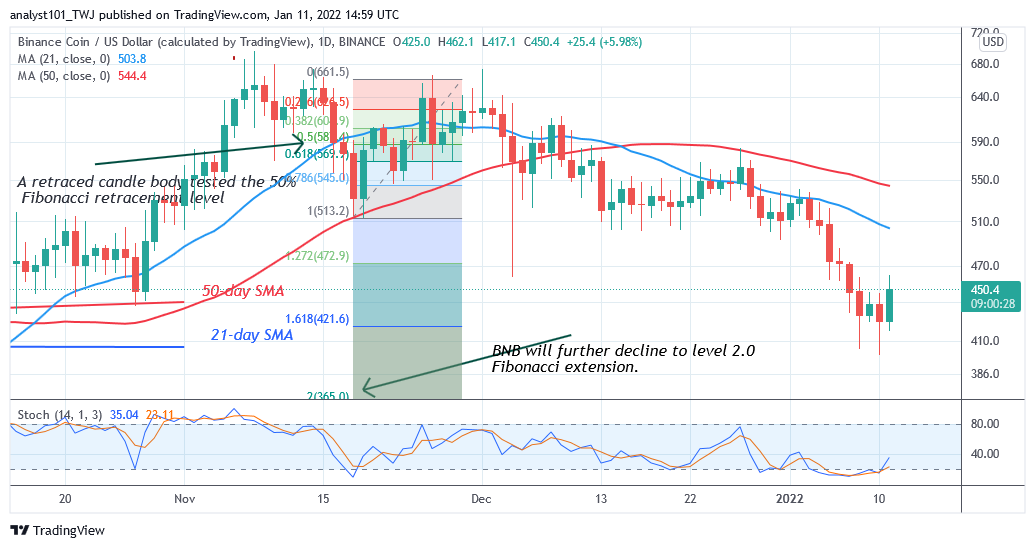
BNB/USD has commenced resumption of uptrend as it holds above $420 support. The selling pressure is likely to subside as the market reaches the oversold region. Meanwhile, on November 18 downtrend; a retraced candle body tested the 50% Fibonacci retracement level. The retracement indicates that Binance Coin will fall to level 2.0 Fibonacci extension or $365.0. From the price action, the market is reversing above the $420 support.
You can purchase crypto coins here. Buy Tokens
Note: Cryptosignals.org is not a financial advisor. Do your research before investing your funds in any financial asset or presented product or event. We are not responsible for your investing results