Polygon (MATIC/USD) Price Sheds Values, Rebuilding Stances
Estimated Reading Time: 3 minutes
Don’t invest unless you’re prepared to lose all the money you invest. This is a high-risk investment and you are unlikely to be protected if something goes wrong. Take 2 minutes to learn more
Polygon Price Prediction – November 26
A significant correctional price motion has taken place in the operations of Polygon versus the US Dollar and has resorted to a divergence, showing the crypto trade sheds values and is rebuilding stances above the point of $0.70.
Considering that the middle Bollinger Band trend line has been approached, the major resistance at $0.85 has been tentatively approached. It seems that bulls might need to enter a pause period in order to potentially sustain a line of bouncing inputs over time. It demonstrates how indicators are pointing northward, indicating that an upward trend is at its highest level. On the basis of that claim, investors in long-term funds are recommended to stick with growing their portfolio sizes even in the event of declines.
MATIC/USD Market
Key Levels:
Resistance levels: $0.85, $0.95, $1.05
Support levels: $0.65, $0.60, $0.55
MATIC/USD – Daily Chart
The MATIC/USD daily chart showcases the crypt market sheds values after approaching the resistance line of $1, rebuilding stances above the point of $0.70.
The Bollinger Band trend lines are positioning northwardly, showcasing that the upper indicator has been placed between the points of $1 and $0.90, as the middle and lower Bollinger Bands are placed northward to affirm that points between $0.80 and $0.70.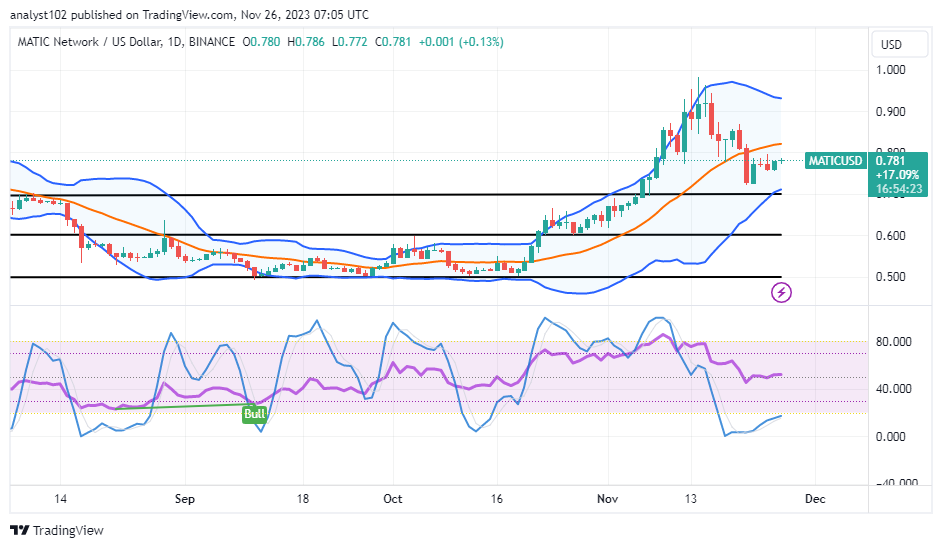
While the MATIC/USD trade is negotiating around $0.781, what directional forces are there to the downside against the lower Bollinger Band at $0.70?
Buyers are liable not to give in more abrupt fall-offs against the line of $0.70, as the MATIC/USD market sheds values, rebuilding stances to keep a positive promissory price motion.
There has been a recovery process running between the $0.80 and $0.70 value lines. The stochastic oscillators in the oversold area may now require long-position placers to be placed in tandem with the velocity. Bulls are supposed to give the current uprising forces life in order to smash through overhead barriers, as we have been doing.
The stochastic oscillators have crossed into the oversold area due to the present trade positional status. An abrupt decrease is pushing against the $0.70 mark. By displaying bullish candlesticks at lower-trading zones or around the point of the lower Bollinger Band trend line, it is thought that sellers would not have trustworthy stables.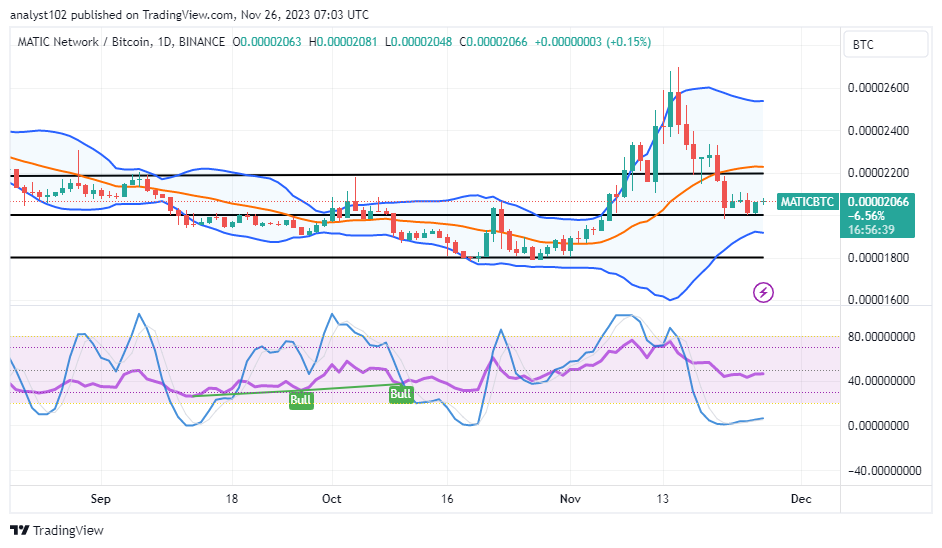
MATIC/BTC Price Analysis
In comparison, the Polygon business sheds values that pair with the valuation of Bitcoin, rebuilding stances around the trend line of the lower Bollinger Band.
As of this technical analysis, a series of smaller bullish candlesticks is in place, and the stochastic oscillators are in the oversold area, suggesting that the base cryptocurrency is in the process of recovering its footing. The Bollinger Band trend lines are positioned briefly easterly from their recent northward-facing direction, denoting the market is on the verge of regaining baseline to make swing highs afyerward.
Note: Cryptosignals.org is not a financial advisor. Do your research before investing your funds in any financial asset or presented product or event. We are not responsible for your investing results.
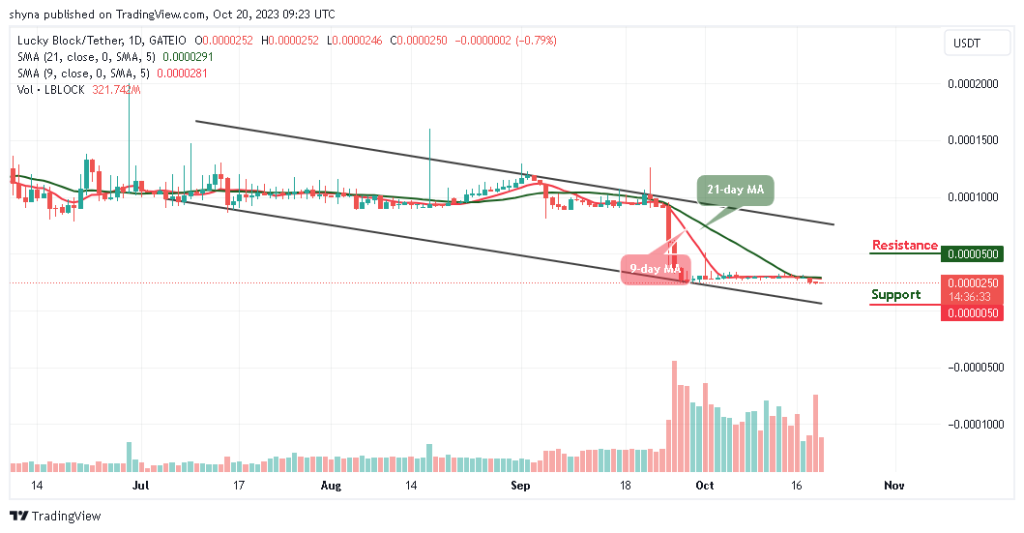
You can purchase Lucky Block here. Buy LBLOCK