Polygon (MATIC/USD) Price Consolidates Positively, Eyeing $1
Estimated Reading Time: 4 minutes
Don’t invest unless you’re prepared to lose all the money you invest. This is a high-risk investment and you are unlikely to be protected if something goes wrong. Take 2 minutes to learn more
Polygon Price Prediction – November 14
Bulls in the market operations that involve Polygon and the US Dollar have continued to outpace the activities of bears as the cryptocurrency trade consolidates positively, eyeing the resistance of $1.
As of this technical piece, the market’s trend pattern does not offer a good entry point for sellers to make a recovery. In a promissory note, there has been an indication to expect additional rising forces beyond the current trading price of $0.0938 at a positively adjusted average percentage rate of 6.23. An extension in valuation will take effect without a clear entry pattern if sellers are discovered to be hesitant to delay the advances northward at this time.
MATIC/USD Market
Key Levels:
Resistance levels: $1, $1.10, $1.20
Support levels: $0.75, $0.65, $0.55
MATIC/USD – Daily Chart
The MATIC/USD daily chart showcases the crypto market consolidating positively alongside the upper Bollinger Band trend line, eyeing the resistance level of $1.
Variant candlesticks have formed alongside the pathway of the upper Bollinger Band trend line; the middle trend line points toward the north direction, with the lower side staying below the point of $0.60. The stochastic oscillators are in a repositioning condition, trying to point back northward, close to 40 to around 80 values.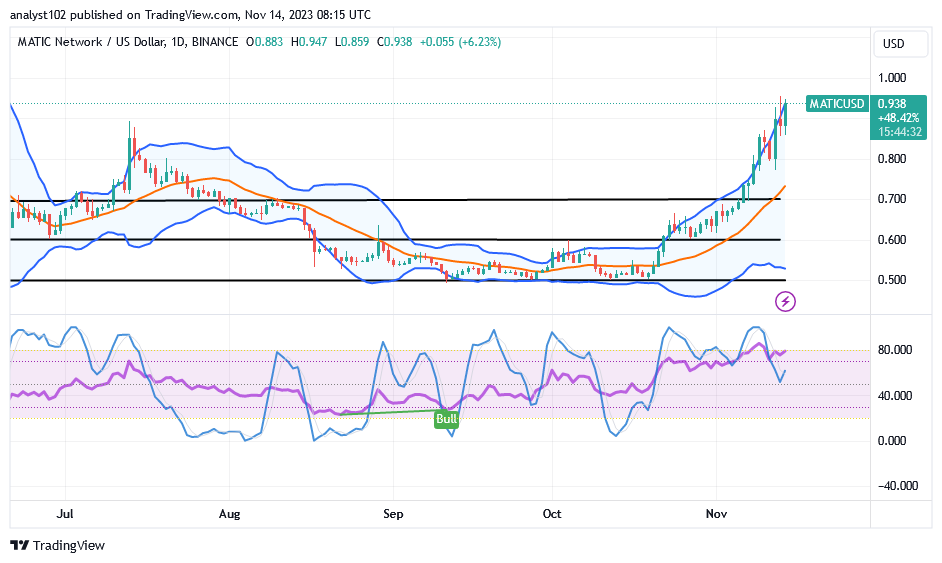
What kind of challenging resistance trade scenario might thwart the bullish momentum in the MATIC/USD market presently?
Over time, MATIC/USD trade buyers have been pushing northwardly alongside the way of the upper Bollinger Band indicator, given that the crypto trade consolidates positively, eyeing the resistance line of $1.
A strong pullback coupled with a sudden reversal at a specific moment would enable bears in the MATIC/USD market to launch a forceful move against some of the established appreciation values. Short-position takers should exercise caution before entering the market in the interim, particularly if the price appears to be forming a slow-and-steady upward trend.
When viewed from a technical perspective, long-position placers seem to have possessed the necessary marginal inclination to enter a bullish trading cycle. Assuming that the assumption materializes as expected, investors ought to adopt the trading spirit strategy of purchasing and holding until the complete upsurge sessions unfold in the coming months.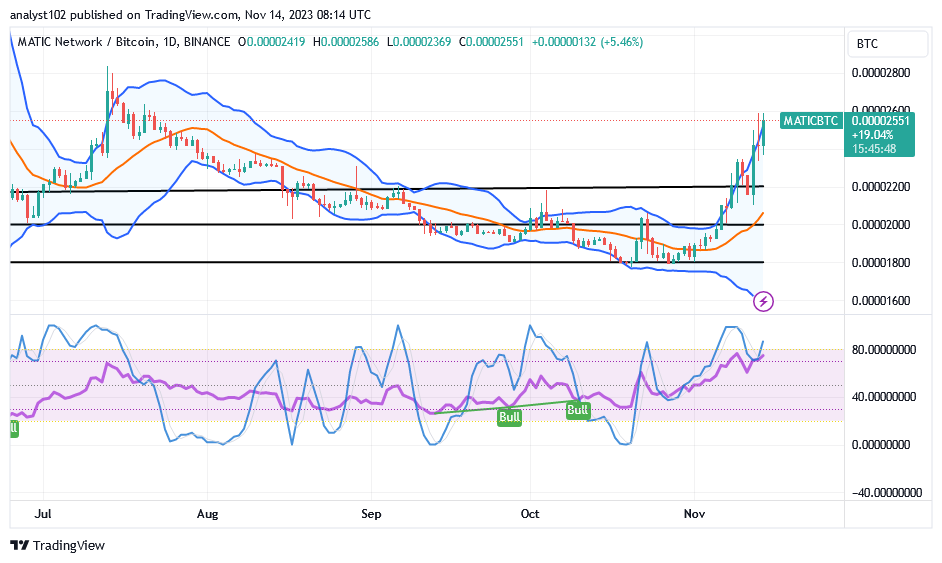
MATIC/BTC Price Analysis
In comparison, the Polygon market consolidates positively against the valuation of Bitcoin, eyeing some resistances above the upper Bollinger Band trend line.
The higher Bollinger Band trend lines extend northward along a string of daily bullish candlesticks, while the lower line remains well below them. The center line then points northward from the lower section. From about the value of 80, the stochastic oscillators are moving northward. In contrast to the counter-trading crypto economy, the basic cryptocurrency has built up a formidable speed toward attaining most rises rather than falling victim to declines. Furthermore, these presumptions typically come to pass in subsequent endeavors.
Note: Cryptosignals.org is not a financial advisor. Do your research before investing your funds in any financial asset or presented product or event. We are not responsible for your investing results.
You can purchase Lucky Block here. Buy LBLOCK