Polygon (MATIC/USD) Market Waxes Highly; It’s Based on $0.80
Estimated Reading Time: 3 minutes
Don’t invest unless you’re prepared to lose all the money you invest. This is a high-risk investment and you are unlikely to be protected if something goes wrong. Take 2 minutes to learn more
Polygon Price Prediction – November 20
Sequentially, some moments have been characterized by steady rises that are tentatively ranging below the resistance line of $1, given that the crypto-economic market waxes highly and is based on $0.80 as of this technical piece.
Bulls in the MATIC/USD trade are in the mood to pull higher from the $0.80 mark, as psychological evidence has shown, with an indicator confirming the move in the direction of securing respectable purchase orders. Given that the present negotiating time is trading at approximately $0.851 with a minute negative percentage rate of 0.23, traders should be cautious of low-active forces that could undermine their entrance.
MATIC/USD Market
Key Levels:
Resistance levels: $1, $1.10, $1.20
Support levels: $0.75, $0.70, $0.65
MATIC/USD – Daily Chart
The MATIC/USD daily chart reveals the crypto-economic market waxes highly; it’s based on $0.80, which supports the presence of the middle Bollinger Band from underneath.
The stochastic oscillators have dipped into the oversold region with the blue line, touching the point of zero to indicate that some falling forces are in the mood of ending soon. The Bollinger Band trend lines are placed northwardly. And they are harboring a series of candlesticks between the values of $1 and $0.80.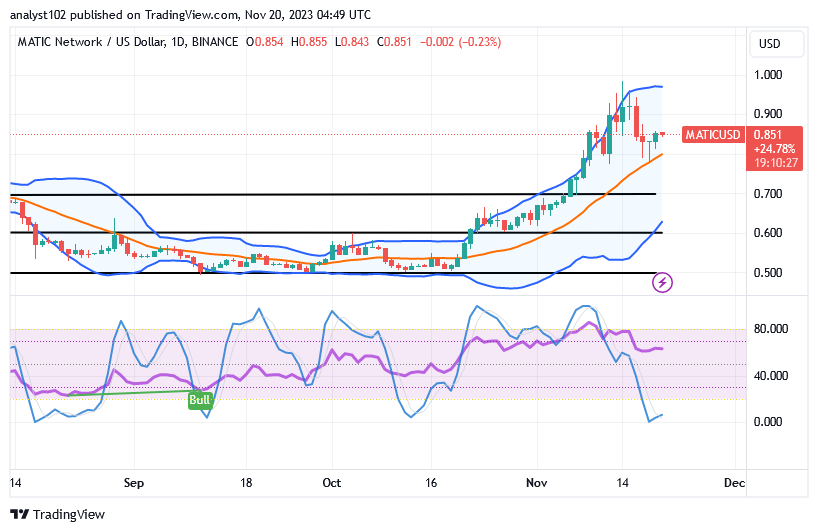
At its current trading position, what trade capacity index does the MATIC/USD market have?
It has been relatively range-bound trading situations in the market operations of MATIC/USD, as the cryptocurrency waxes highly; it’s based on $0.80.
It has been demonstrated that bulls are likely to halt increases from the middle trend line of the Bollinger Band. It appears that prices will probably move sideways for some time, hovering between $0.90 and $0.80. In the interim, forces to back free fall-offs have been lowered to some degrees, as indicated by the stochastic oscillators.
The market has only resorted to constructing a rejection pattern right below the $1 resistance line; therefore, sellers should use caution when executing orders for shorting positions. Technically speaking, it would be preferable for bears to be positioned alongside the repositioning mode at high values in order to presage a southbound-curving style and signal that the market will lose momentum.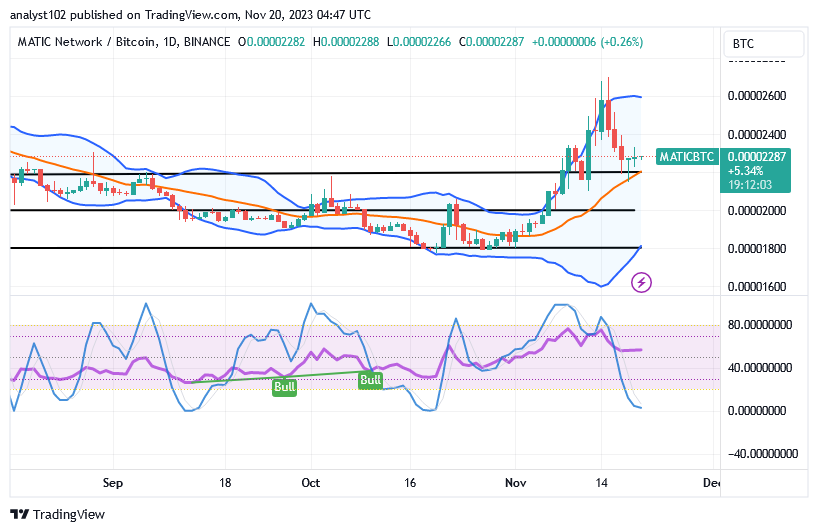
MATIC/BTC Price Analysis
In comparison, the Polygon trade waxes highly versus the pushing weight of Bitcoin; it’s based on the trend line of the middle Bollinger Band.
The upper half of the Bollinger Band has been briefly curved to the east. The trend lines of the band point from the lower and middle parts northward. The blue line of the stochastic oscillators has crossed into the oversold area, suggesting that the base cryptocurrency is making an effort to strengthen its positions against the counter-trading crypto instrument.
Note: Cryptosignals.org is not a financial advisor. Do your research before investing your funds in any financial asset or presented product or event. We are not responsible for your investing results.
You can purchase Lucky Block here. Buy LBLOCK