Ripple (XRP) falls in a Minor Retracement, Battles Resistance at $1.70
Estimated Reading Time: 2 minutes
Don’t invest unless you’re prepared to lose all the money you invest. This is a high-risk investment and you are unlikely to be protected if something goes wrong. Take 2 minutes to learn more
Ripple (XRP) Long-Term Analysis: Bullish
Today, buyers pushed XRP and retested the $1.70 resistance level. Presently, the altcoin is retracing in a downward move. This has been the price action since May 1. Buyers have been retesting the resistance zone but unable to sustain the bullish momentum above it. XRP is now in a range-bound move below the resistance level. On the upside, if buyers breach the resistance level, XRP will rally and retest the $1.96 overhead resistance.
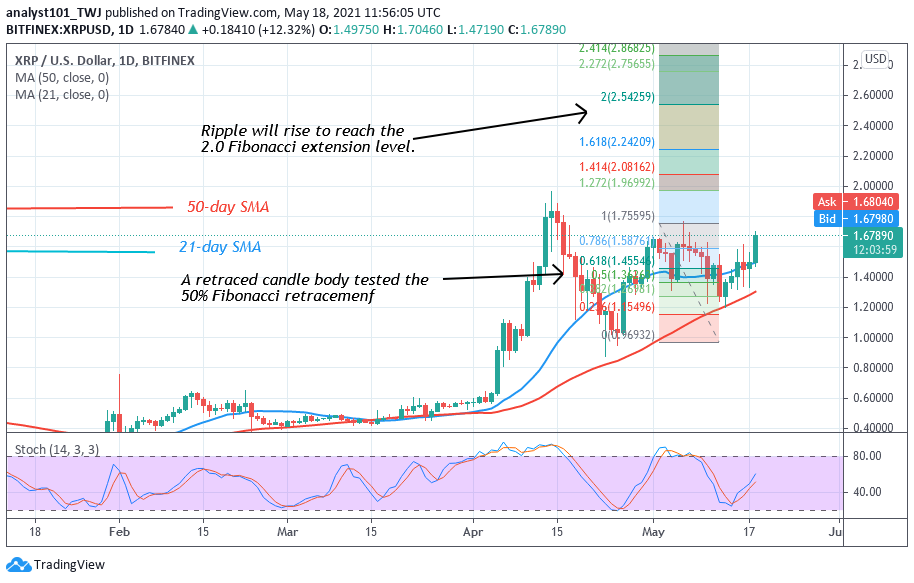
Also, if the bullish momentum is sustained above the $1.96 resistance, XRP will rise and attain a new high of $2.50. Nevertheless, if buyers fail to breach the $1.70 resistance, XRP will continue the range-bound movement for a few more days. Meanwhile, on May 1 uptrend; a retraced candle body tested the 50% Fibonacci retracement level. The retracement indicates that Ripple will reach the 2.0 Fibonacci extension level or level $2.54.
Ripple (XRP) Indicator Analysis
XRP is above the 40% range of the daily stochastic. It indicates that the market is in a bullish momentum. XRP price has fallen to the support above the 21-day SMA. Ripple will rise as long as the crypto price is above the moving averages. The SMAs are sloping upward indicating the uptrend.
Technical indicators:
Major Resistance Levels – $2.00, $2.50, $3.00
Major Support Levels – $1.50, $1.00, $0.50
What Is the Next Direction for Ripple (XRP)?
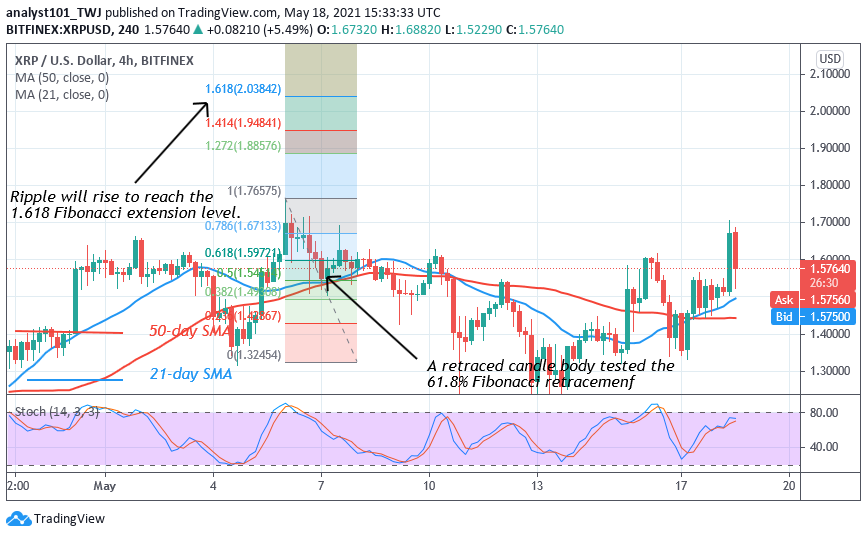
Ripple is still confined below the resistance at $1.70. The Fibonacci tool has indicated an upward movement of the coin. On the 4-hour, a retraced candle body tested the 61.8% Fibonacci retracement level. The retracement indicates that Ripple will reach the 1.618 Fibonacci extension level or level $2.03.
Note: cryptosignals.org is not a financial advisor. Do your research before investing your funds in any financial asset or presented product or event. We are not responsible for your investing results