Bitcoin (BTC/USD) Price Fluctuates at $50,000
Estimated Reading Time: 3 minutes
Don’t invest unless you’re prepared to lose all the money you invest. This is a high-risk investment and you are unlikely to be protected if something goes wrong. Take 2 minutes to learn more
Bitcoin Price Prediction – December 24
Over a couple of sessions, the BTC/USD market operation has been experiencing lower-highs as the crypto-economic price fluctuates at $50,000 psychological trading spot. The crypto’s activities are about a smaller negative percentage rate of 1.11, trading around $49,978 as of writing.
BTC/USD Market
Key Levels:
Resistance levels: $52,500, $55,000, $57,500
Support levels: $45,000, $42,500, $40,000
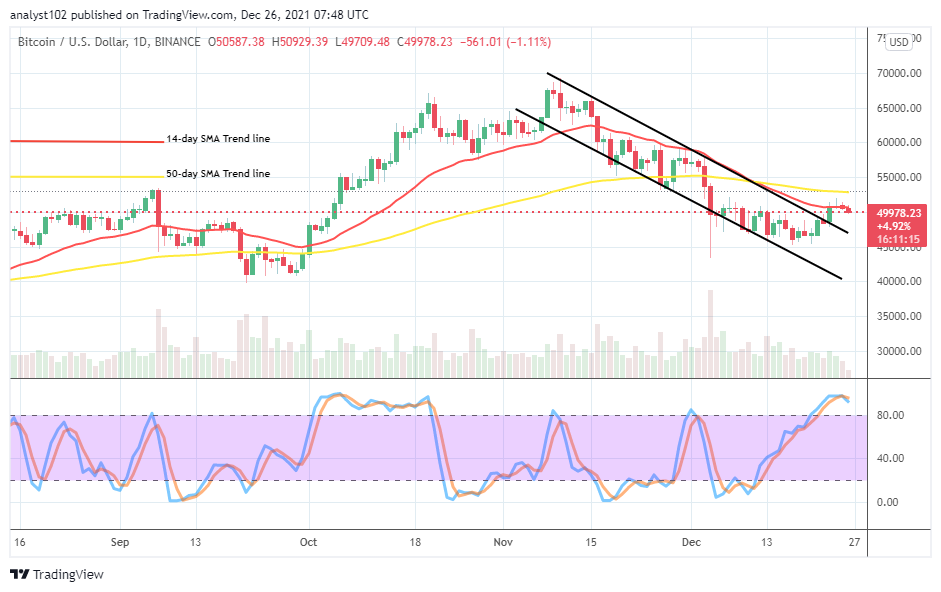
BTC/USD – Daily Chart
The BTC/USD daily chart reveals that the crypto-economic price fluctuates at the $50,000 trading level as the smaller SMA’s trend line witnesses a short line of lower upswings and downswings around it. The 50-day SMA indicator is above the 14-day SMA indicator within $55,000 and $50,000 levels. The Stochastic Oscillators are in the overbought region, with their lines conjoined, slightly pointing southbound within it. That indicates the potentiality of getting to see the crypto economy, reverting to selling conditions in the near time.
Is there any indication that the BTC/USD will push for higher levels as the crypto-economic price fluctuates at $50,000?
The BTC/USD market has reached an overbought outlook and, it won’t be easy to witness higher levels more as the crypto-economic price fluctuates at $50,000 over time until the present. Price consolidation movements around the value-line for a long time will cause an appropriate trade projection to persist until the market pushes into a definite direction. A quick take of those assumptions brought back focuses on the sudden aggressive breakout at the point mentioned earlier to achieve part of the last lost momentums.
On the downside of the technical analysis, the BTC/USD market short-position takers would have to base their efforts on intensification beneath the trend line of the 50-day SMA. But, the current pace of the price pushing around the $50,000 doesn’t signify a reliable trading situation for both the two market movers. Short-position takers needed to await a bearish candlestick emerging around the 50-day SMA against the value line to launch a decent sell order.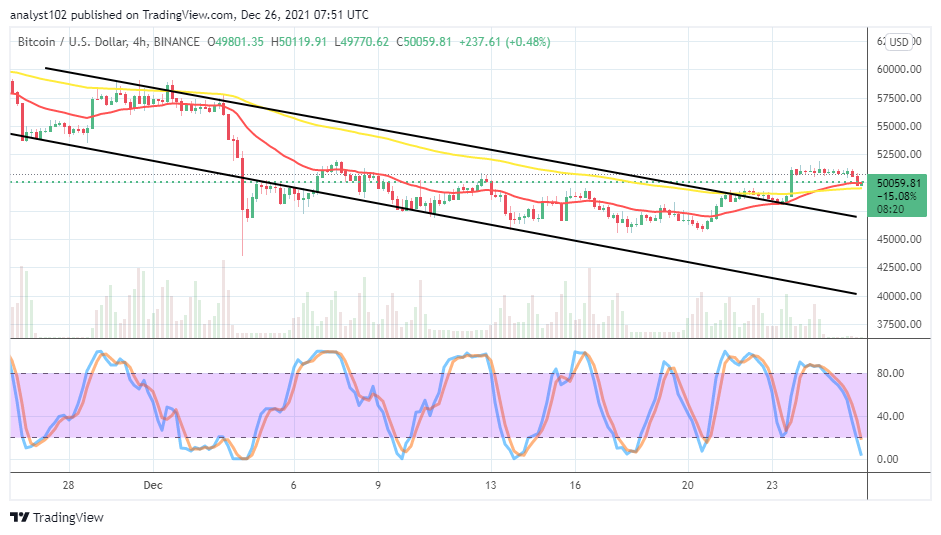
BTC/USD 4-hour Chart
The BTC/USD medium-term chart also showcases a perfect line as the crypto-economic price fluctuates in $52,500 and $50,000 levels. Notably, there has been a drop in the market operations closely around the lesser value line. The 14-day SMA has briefly intercepted the 50-day SMA to the upside. And they are around the smaller level. The Stochastic Oscillators are in the oversold region, pointing toward the southbound near over the range of zero. That suggests that a downward force, relatively playing out presently.
Note: Cryptosignals.org is not a financial advisor. Do your research before investing your funds in any financial asset or presented product or event. We are not responsible for your investing results.
You can purchase crypto coins here. Buy Tokens