Wall Street Memes (WSM) Trade Affirms Basis, Tending Bounces
Estimated Reading Time: 3 minutes
Don’t invest unless you’re prepared to lose all the money you invest. This is a high-risk investment and you are unlikely to be protected if something goes wrong. Take 2 minutes to learn more
Wall Street Memes Price Prediction – March 13
The production of leftovers in the mode of reductions has been tentatively making a lead featuring bears around the surroundings of $0.001, as the WSM/USD trade affirms basis, tending bounces in its signal setup.
The base instrument is currently oscillating around the lower boundaries of the Bollinger Bands, signaling an optimal entry point for buyers to capitalize on. This trend presents a compelling opportunity for buyers to initiate significant positions, as the market is poised for a potential aggressive rebound, likely occurring without prior warning.
WSM/USD Market
Key Levels
Resistance levels: $0.002, $0.0025, $0.003
Support levels: $0.001, $0.0008, $0.0006
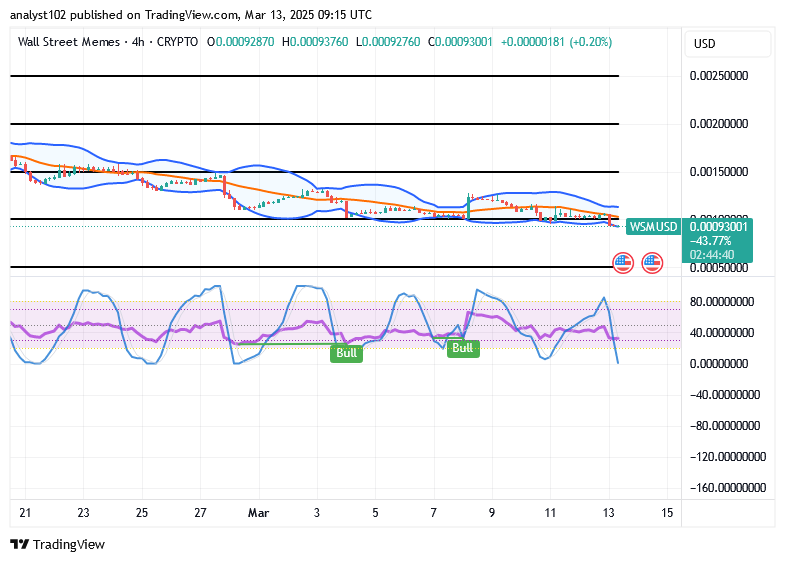
WSM/USD – 4-hour Chart
The medium-term chart (4-hour chart) of the WSM/USD trade presently affirms a basis around the $0.001 value line, tending to bounce at various moves.
The prevailing trend of the Bollinger Bands indicators remains firmly anchored at the lower boundary, reinforcing the likelihood of buying pressure emerging around the $0.001 level shortly. Meanwhile, the stochastic oscillators are oscillating within the oversold region, signaling the potential for an imminent rebound as the market prepares for a resurgence.
Will the trade then go on a downward consolidation move based on the WSM/USD pair’s current market trend?
Seeing or expecting the WSM/USD market operations running into a steady, fearful southward consolidation away from the point of $0.001 might not be ideally technical for shorting positions because such attempts are most times prone to witnessing a sudden shoot-up, given that the current condition shows that the price affirms basis, tending to bounce in its signal inputs.
Being as it is, shorting of position orders should be carefully evaluated, avoiding reliance on expectations of continued downward momentum, even if the market dynamics have yet to fully catalyze a bullish surge. The WSM/USD market’s response suggests that caution is needed, as the current price action lacks strong confirmation of sustained bearish pressure.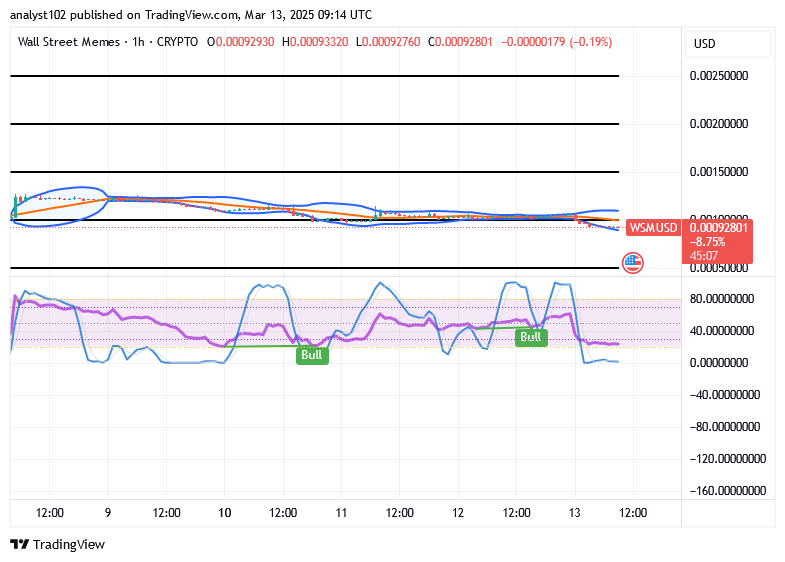
WSM/USD 1-hour chart
The 1-hour chart of the WSM/USD trade reveals that the crypto-economic trade maintains its basis, tending to bounce in its signal arrangement.
The stochastic oscillators, currently positioned in the oversold region on an hourly timeframe, suggest that buyers may soon regain momentum. Meanwhile, the Bollinger Bands trend lines are oriented eastward, indicating that holding positions is attracting increased attention from sellers, who may look to delay further downward movement.
Trump is buying the $TSLA decline in full.
Buy and stake WSM now!: Wall Street Meme (WSM)
Trump fully buying the $TSLA dip https://t.co/2iADXDMOhh
— Wall Street Memes (@wallstmemes) March 12, 2025