Lucky Block Price Prediction: LBLOCK/USD Ranges Above $0.0030; A Time to Buy
Estimated Reading Time: 2 minutes
Don’t invest unless you’re prepared to lose all the money you invest. This is a high-risk investment and you are unlikely to be protected if something goes wrong. Take 2 minutes to learn more

Free Crypto Signals Channel
The Lucky Block price prediction shows that LBLOCK is moving sideways as the coin moves below the 9-day moving average.
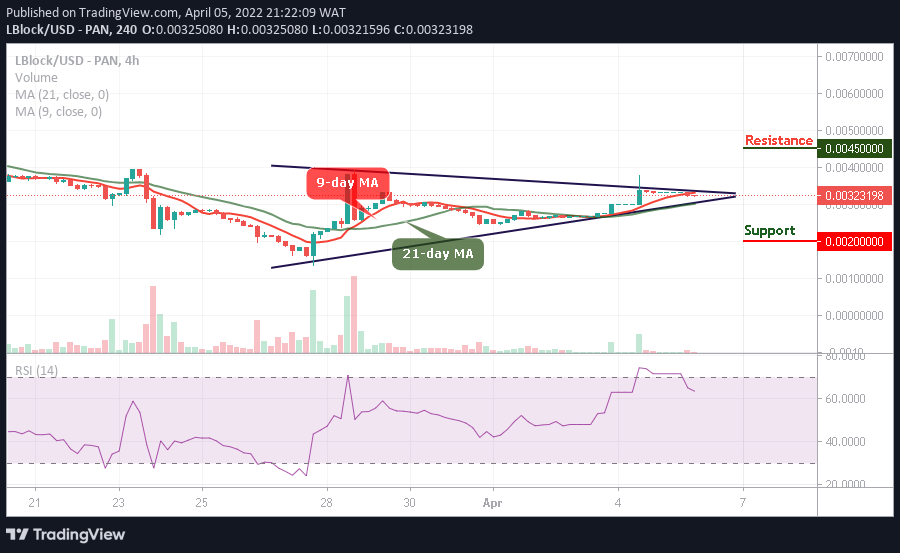
LBLOCK/USD Medium-term Trend: Ranging (4H Chart)
Key Levels:
Resistance levels: $0.0045, $0.0050, $0.0055
Support levels: $0.0020, $0.0015, $0.0010
LBLOCK/USD is trading within the 9-day and 21-day moving averages as the market price prepares to cross above the upper boundary of the channel. However, the bullish momentum would prepare the coin for the upside to reach the nearest resistance at $0.0040. Nevertheless, should the bulls fail to push the price upward, the Lucky block price may continue with the sideways movement, allowing new investors to enter the market.
Lucky Block Price Prediction: LBLOCK/USD Would Make Upward Corrections
The Lucky Block price may rise and break above the 9-day moving average if the bulls put more pressure. Therefore, any further bullish movement above the upper boundary of the channel may push the price to the potential resistance levels of $0.0045, $0.0050, and $0.0055.
On the contrary, any bearish movement below the lower boundary of the channel could hit the low of $0.0020, $0.0015, and $0.0010 support levels. Therefore, the technical indicator Relative Strength Index (14) nosedives to allow the existing buyers to buy the dips.
LBLOCK/USD Medium-term Trend: Ranging (2H Chart)
Against Bitcoin, the Lucky Block price is currently below the 9-day and 21-day moving averages but any bullish movement above this barrier may touch the resistance level of $0.0040 and above.
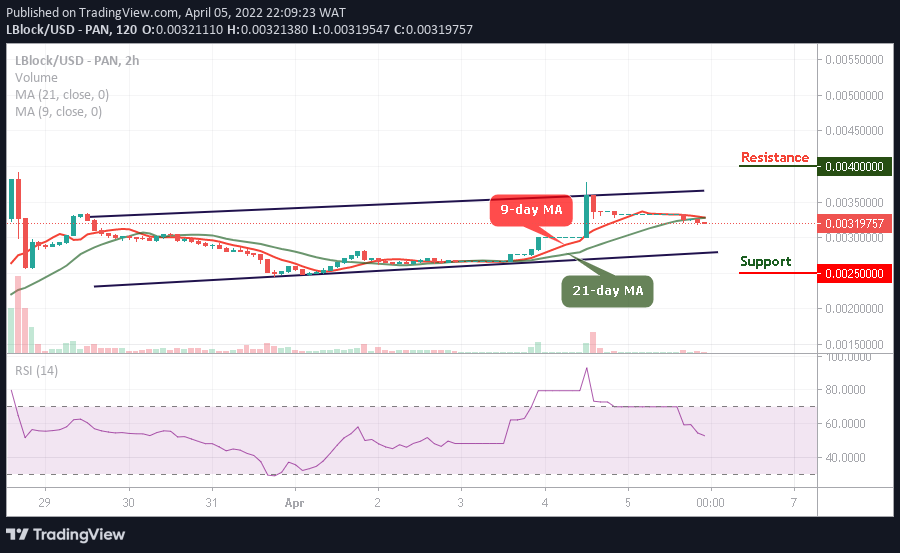
However, if the sellers bring the price towards the lower boundary of the channel as the technical indicator Relative Strength Index (14) heads toward 50-level, the coin may become cheaper for the new investors to enter the market as the nearest support level may be located at $0.0025 and below.
Read more: