Polygon (MATIC/USD) Market Presses Upside, Eyeing $0.90
Estimated Reading Time: 4 minutes
Don’t invest unless you’re prepared to lose all the money you invest. This is a high-risk investment and you are unlikely to be protected if something goes wrong. Take 2 minutes to learn more
Polygon Price Prediction – December 3
A chain of corrections has been witnessed in the business activities that involve the valuation of Polygon versus the worth of the US currency, given that the crypto-economic market is presently pressing upside, eyeing the resistance line of $0.90.
Another crucial underlying support line has been seen in the most recent operations, approximately near the $0.70 mark. As a result, when returning to an upward motion from the lower part of the Bollinger Band across the middle portion and all the way back to the topside beyond close resistances capped by their upper section, long-position movers should be using more muscles. Since the price is now trading at roughly $0.814, investors could be able to continue earning more points. Traders who plan to enter this market at this time should exercise caution when pulling back hard against the previously identified support trade zone.
MATIC/USD Market
Key Levels:
Resistance levels: $0.90, $1, $1.10
Support levels: $0.70, $0.65, $0.60
MATIC/USD – Daily Chart
The MATIC/USD daily chart reveals the cryptocurrency market is pressing upside, eyeing the overhead trade barrier-trading line of $0.90.
The stochastic oscillators have been placed on a movement to produce the blue line across the variant points on the north side. The Bollinger Band indicators are presently positioned strategically around the values of $0.90 and $0.70. As of the moment of this analysis, a lighter candlestick is showing to signify that a pit stop is tending to feature around the middle Bollinger Band trend line.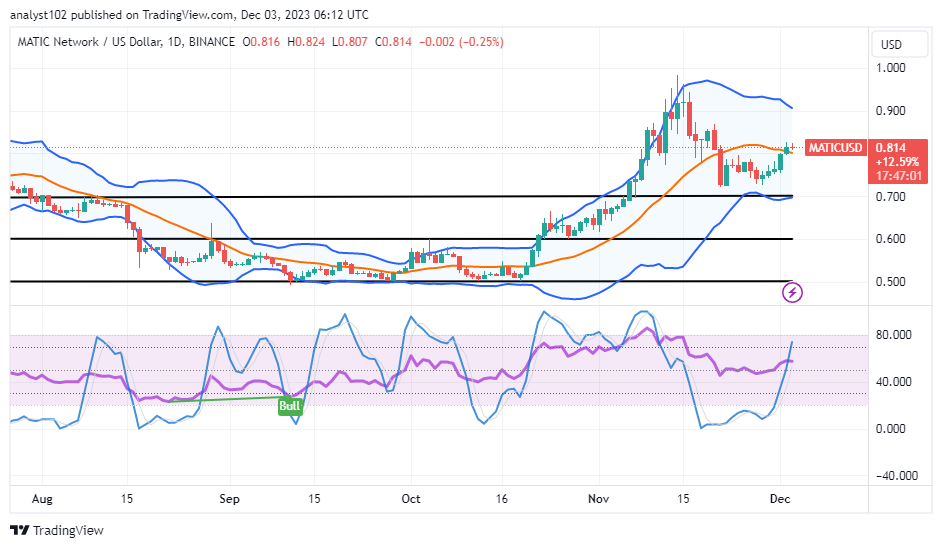
As of the time of this study, what trending force is the MATIC/USD market currently maintaining in the Bollinger Band trend lines?
The MATIC/USD market is tending to keep bouncing to the topside of the middle Bollinger Band trend line, given that the market presses upside, eyeing the resistance point of $0.90.
Some long-position placers may have been too anxious to ride back from a lower-trading axis as it approached the $0.70 point during the correcting force action. In keeping with the current uprising’s movements, purchasers ought to perceive the basic ground previously established on top of that value, providing protection against any potential reversal motion.
It is anticipated that sellers will reestablish trade barriers between the middle and upper Bollinger Bands. Technically speaking, it is not a good idea to start considering resuming a sell order near its present trading position. When determining whether or not the values of the cryptocurrency economy would decline in relation to the US dollar, an overbought reading condition of the stochastic oscillators would provide greater clarity.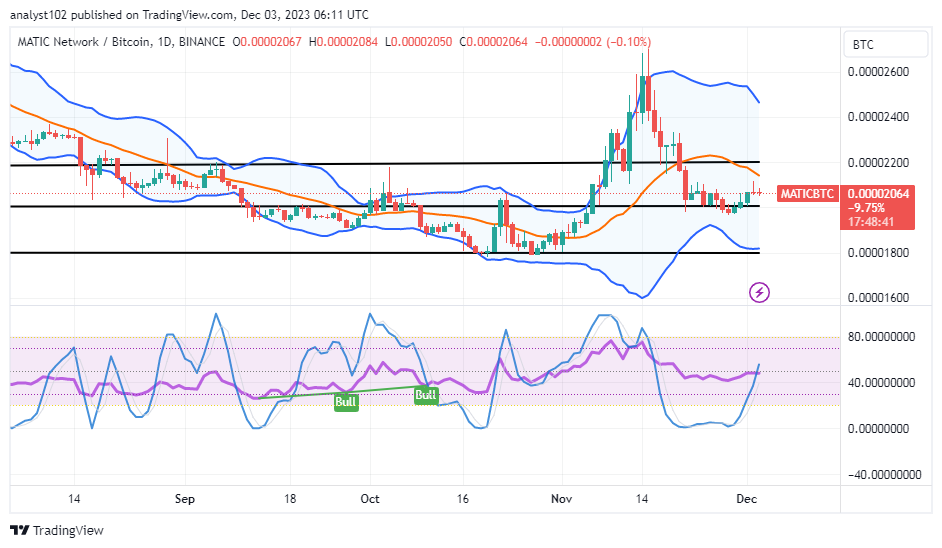
MATIC/BTC Price Analysis
In comparison, the Polygon market presses upside against Bitcoin, eyeing the resistance line of the middle Bollinger Band.
The trend lines of the Bollinger Band are spaced farther apart, which may allow for different uprising forces. For a brief period of time, the stochastic oscillators are positioned between the overbought and oversold levels in the north. In order to indicate that the base instrument may be taking a break from trying to establish a baseline against the quotient cryptocurrency, a series of lesser pulldowns may still occur.
Note: Cryptosignals.org is not a financial advisor. Do your research before investing your funds in any financial asset or presented product or event. We are not responsible for your investing results.
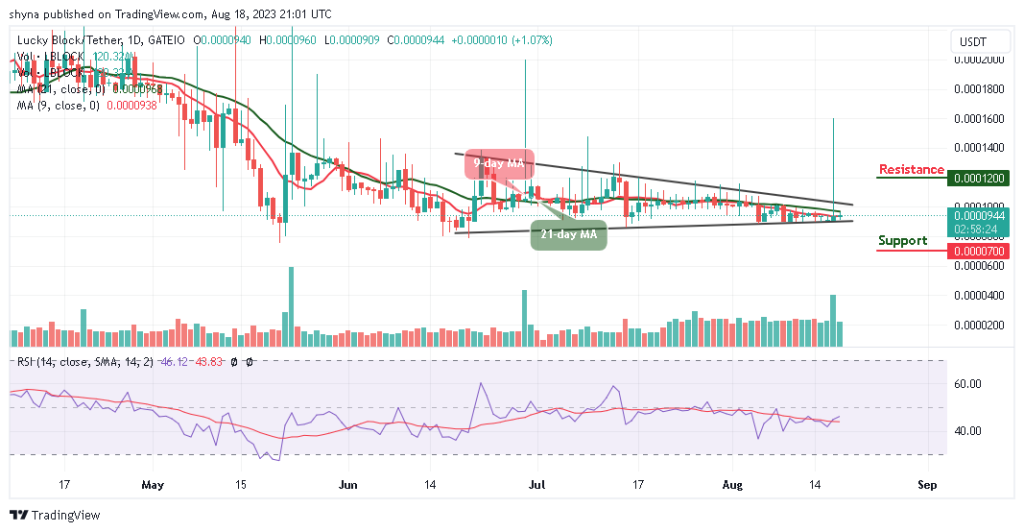
You can purchase Lucky Block here. Buy LBLOCK