Synthetix (SNXUSD) Slips Below the $9.000 Price Level
Estimated Reading Time: 2 minutes
Don’t invest unless you’re prepared to lose all the money you invest. This is a high-risk investment and you are unlikely to be protected if something goes wrong. Take 2 minutes to learn more
SNXUSD Analysis – Price Slips Below $9.000 as Sellers Edge the Market
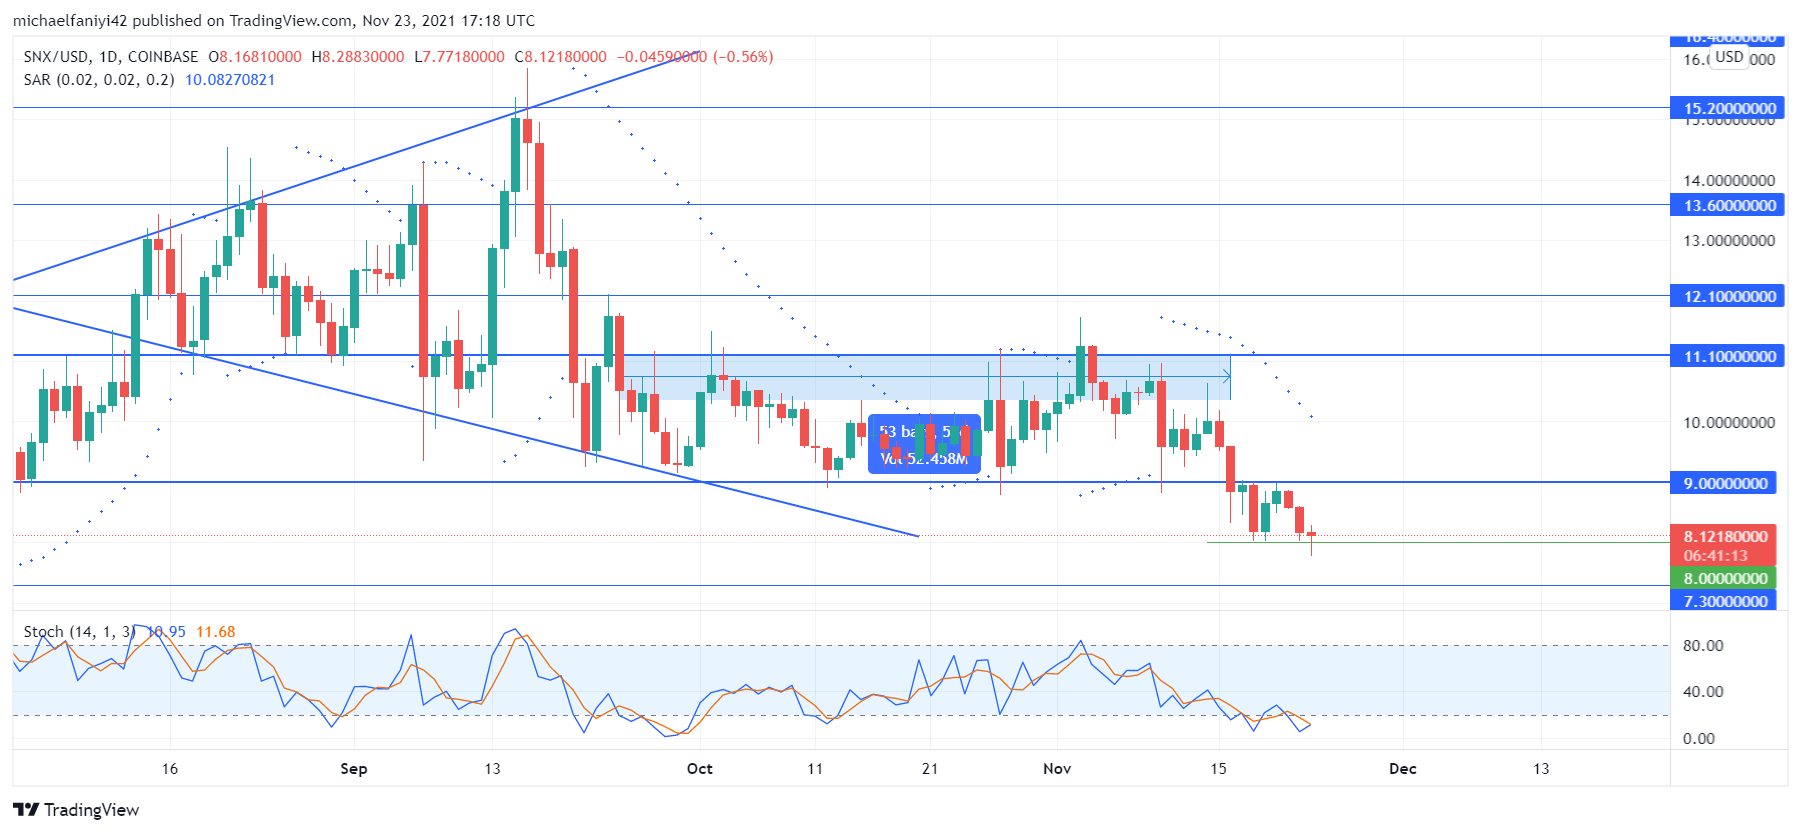
SNXUSD slips below the $9.000 price level as sellers edge the market. The coin has been pounding down on the key level for a while as the market consolidates. Eventually, SNX slips below the critical level on the 16th of November. However, buyers are not deterred by the drop in the market and have upheld the coin on the $8.000 support, where the coin seems to start another accumulation phase.
SNXUSD Key Zones
Resistance Zones: $11.100, $15.200
Support Zones: $9.000, $8.000
The bears had earlier beat down the bullish momentum of the coin and crashed the market below $11.100 on the 24th of September. Thereafter, the price has been trammeled in consolidation between the resistance and the $9.000 support. This lasted for nearly two months, with neither bears nor bulls letting up. Eventually, on the 16th of November, sellers edged the market, and the price slips below the $9.000 support.
Synthetix having found support at $8.000, has pulled back to retest the $9.000 price level and has dropped again. The support still resists the fall in price, but it looks like a matter of time before the market drops further. The gradual drop of the lines of the Stochastic Oscillator even before the price slips below the $9.000 support is a sign of a bearish market. The Parabolic SAR (Stop and Reverse) also has more dots above the daily candles than below them, even as the market undulates.

Market Prospects
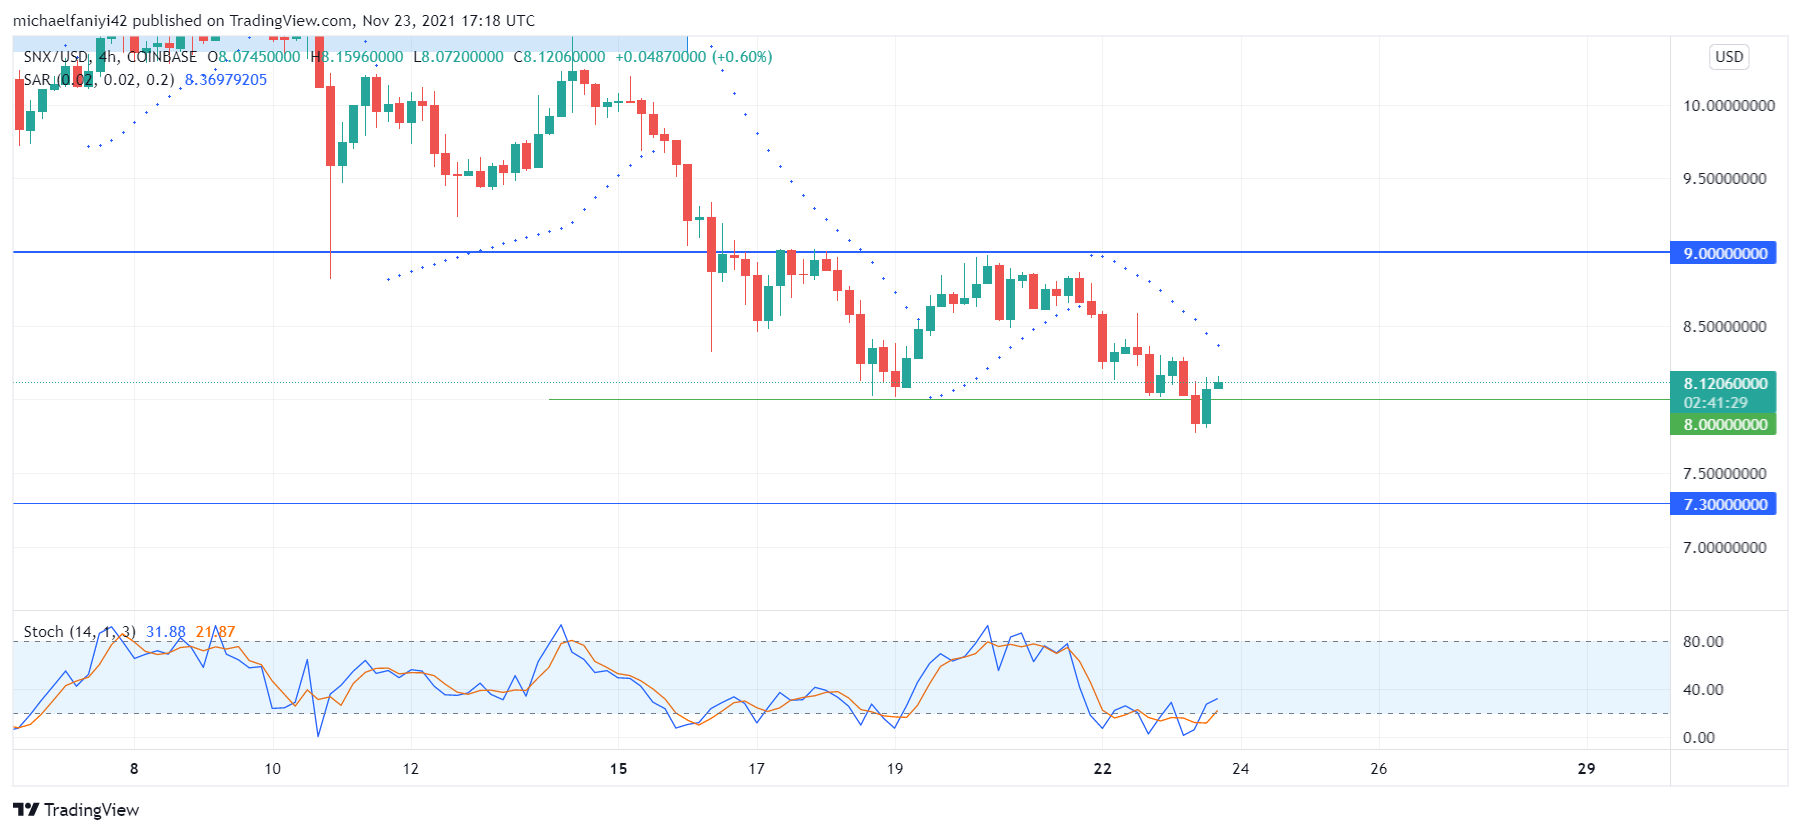
The 4-hour chart suggests that consolidation will go on for a while before the price finally drops. The $8.000. is playing a major role in keeping the coin afloat. Therefore, the lines of the Stochastic Oscillator have crossed upwards, but the dots of the Parabolic SAR remain above the 4-hour candles.
You can purchase crypto coins here: Buy Tokens
Note: Cryptosignals.org is not a financial advisor. Do your research before investing your funds in any financial asset or presented product or event. We are not responsible for your investing results.