Dogecoin (DOGE) Price Prediction: DOGE/USDT Bounces Off the $0.1191 Threshold
Estimated Reading Time: 2 minutes
Don’t invest unless you’re prepared to lose all the money you invest. This is a high-risk investment and you are unlikely to be protected if something goes wrong. Take 2 minutes to learn more

Date: January 26, 2026
The Dogecoin market has recorded a rebound on the positive axis in the ongoing session. This occurred after the market fell sharply during the previous session. From here, it appears that the market may still descend further.
DOGE/USDT Long-Term Trend — Bearish (Daily Chart)
Key Price Levels
Resistance: $0.1300, $0.1500, $0.1700
Support: $0.1250, $0.1100, $0.0950
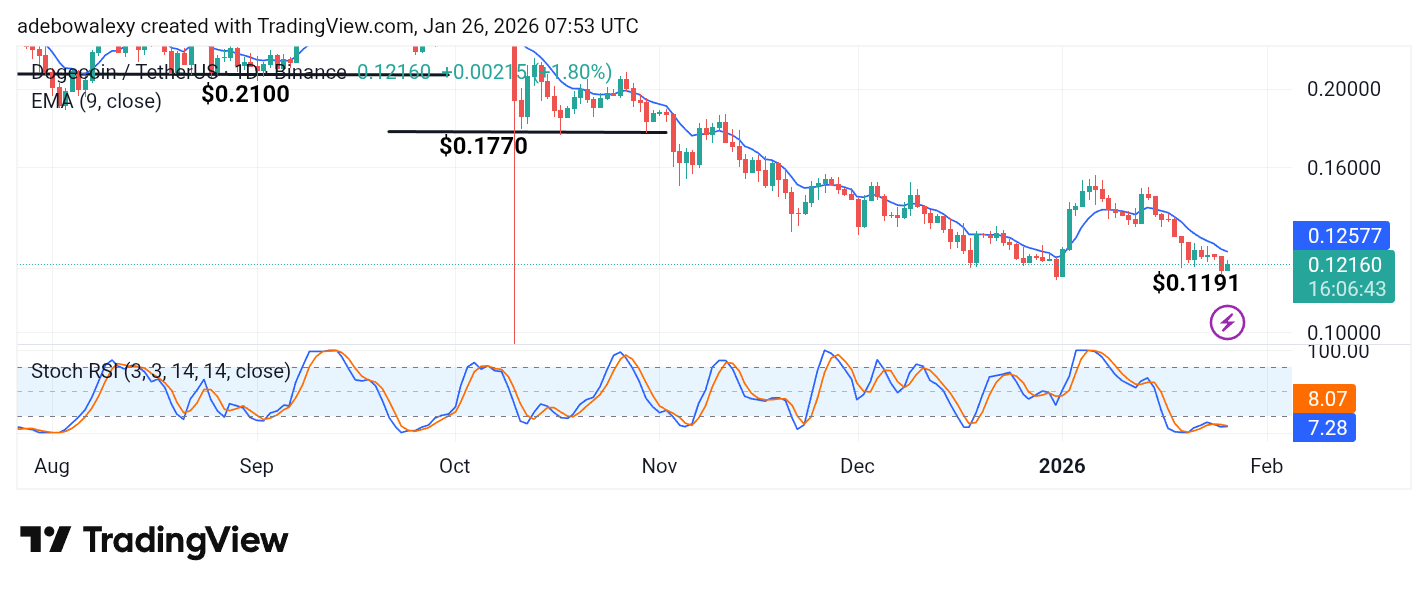
As mentioned earlier, the ongoing session has produced an upward rebound. Consequently, the corresponding price candle for the current session has appeared green but remains below the 9-day Exponential Moving Average (EMA) line.
Similarly, the lines of the Stochastic Relative Strength Index (SRSI) indicator are in the oversold region and are moving sideways. The terminal ends of the indicator lines remain below the 10 mark on the SRSI.
Dogecoin (DOGE) Price Prediction: DOGE/USDT Bears Retain an Edge
Although the Dogecoin market has seen an upward rebound in the ongoing session, downside pressure still appears to dominate. The most recent price candle is green but remains at a notable distance below the 9-day EMA.
This suggests that bearish forces are still influencing price action. Likewise, the SRSI indicator lines remain largely sideways. Consequently, upside momentum continues to be outweighed in the longer term.
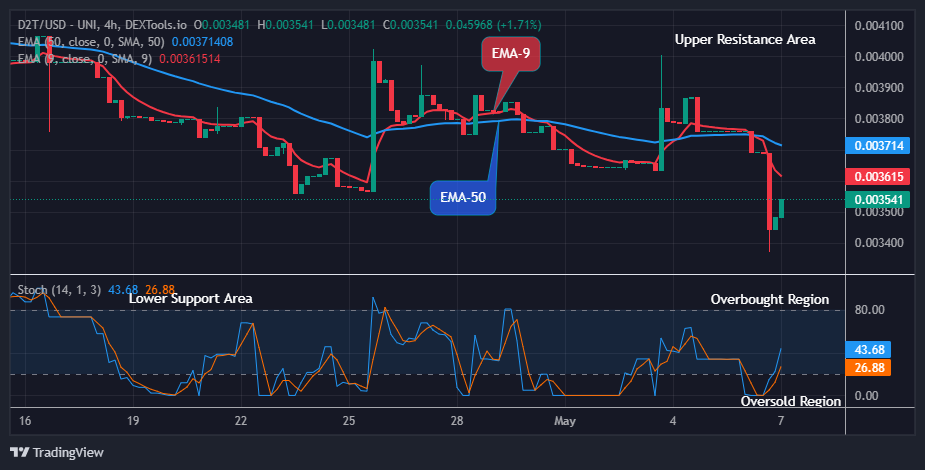
Dogecoin (DOGE) Price Prediction: DOGE/USDT Upside Movement Stays Consistent but Below Critical Levels
On the 4-hour chart, the Dogecoin market shows consistent upside movement. However, as soon as price action pushed through the 9-day EMA curve, the market retreated back below it.
Nevertheless, upward consistency remains intact, as indicated by the green appearance of the last three price candles on the chart. The SRSI indicator lines are still projected upward. Although this may suggest short-term gains, the market could still regress toward the $0.1100 price level.