Dogecoin (DOGE) Price Prediction: DOGE/USDT Falls Sharply
Estimated Reading Time: 2 minutes
Don’t invest unless you’re prepared to lose all the money you invest. This is a high-risk investment and you are unlikely to be protected if something goes wrong. Take 2 minutes to learn more

Date: January 19, 2026
The Dogecoin market has resumed its bearish trend. Price action in this market can be seen diving steeply toward lower price levels. Traders might want to respect the trend at this point.
DOGE/USDT Long-Term Trend — Bearish (Daily Chart)
Key Price Levels
Resistance: $0.1300, $0.1500, $0.1700
Support: $0.1250, $0.1100, $0.0950
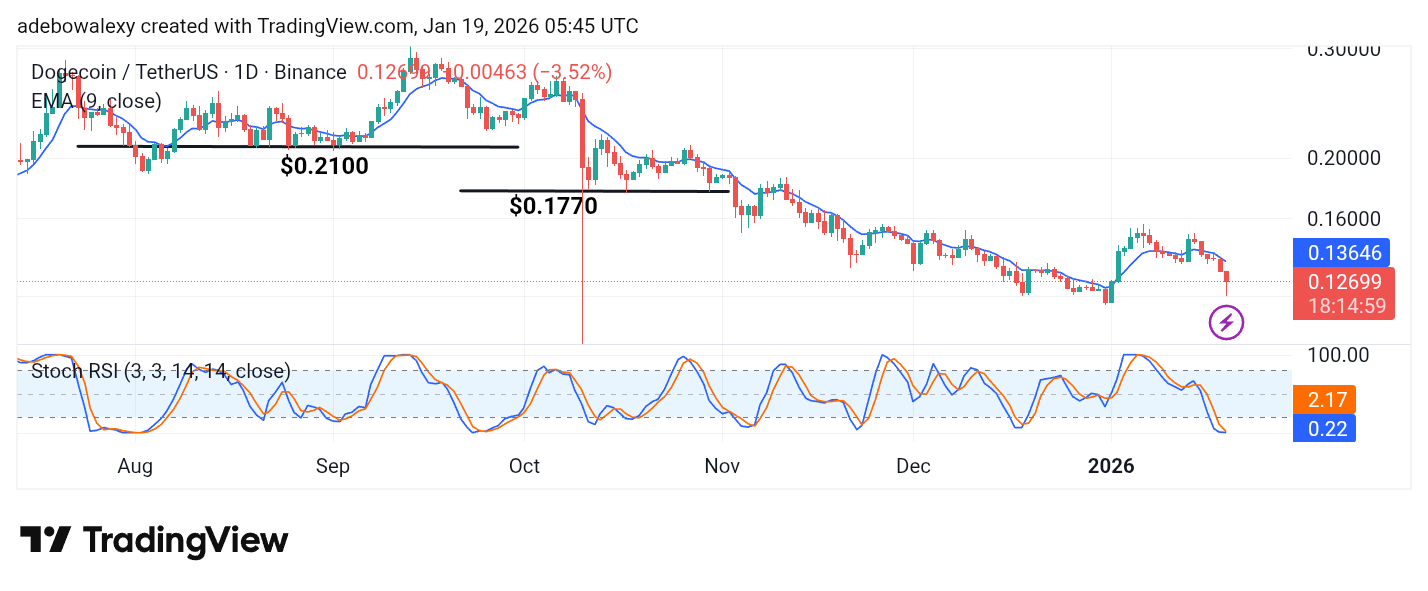
For about six sessions straight, price action can be seen trending downward consistently. The last price candle here is a bearish one and has appeared below the 9-day Exponential Moving Average (EMA) line. The lines of the Stochastic Relative Strength Index (SRSI) indicator can be seen still converging for a trend-shifting crossover in the overbought zone of the indicator, just below the 2.50 threshold.
Dogecoin (DOGE) Price Prediction: DOGE/USDT Bearish Momentum Seems Strong
With bearish forces dominating the Dogecoin daily market for six sessions straight, the ongoing trading session can be seen heading further south and below the 9-day EMA curve. In fact, it can be observed that the ongoing session presented a much steeper dive earlier in the session.
However, as trading continued, there was a positive pullback, leaving the corresponding price candle with a lower shadow. The lines of the SRSI indicator can be seen converging for an upside crossover in the oversold region of the indicator. At this point, traders may want to watch the market closely.
Dogecoin (DOGE) Price Prediction: DOGE/USDT Shapes to Keep Headwinds Dominant (4-Hour Chart)
On the Dogecoin 4-hour price chart, one can see that price action in the current session seems headed in the same direction as the previous session.
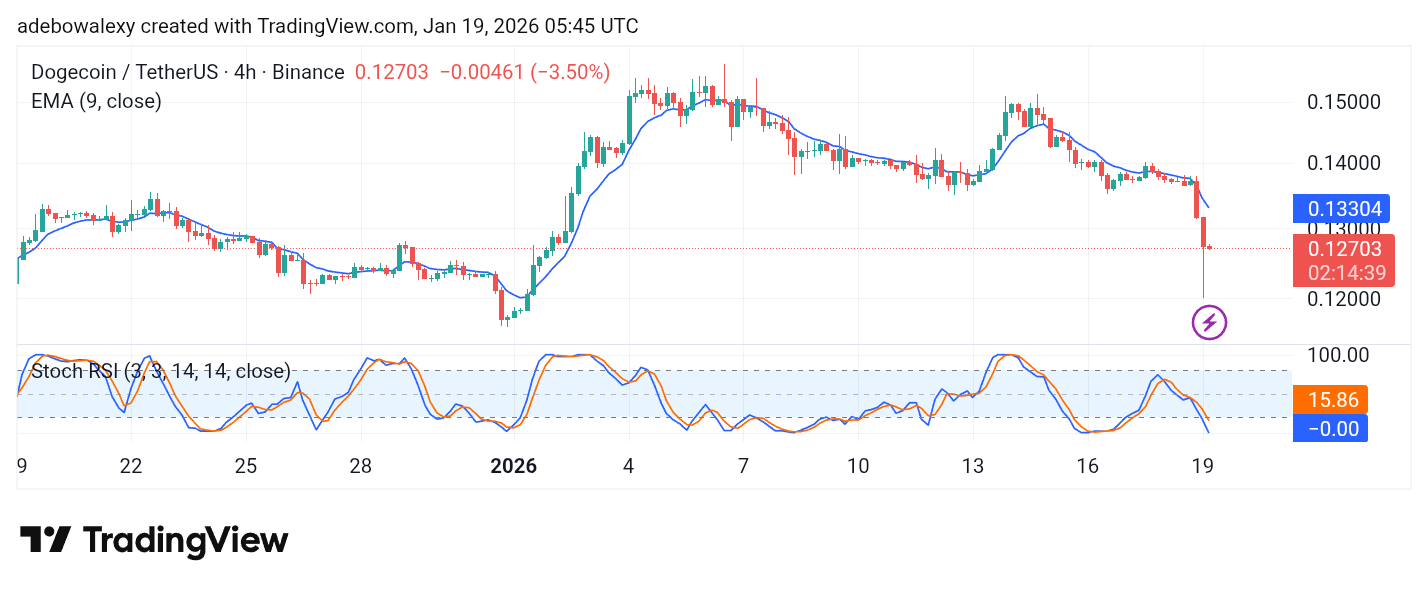
The last price candle on this chart is red but has a small body. As a result, it lies below the 9-day EMA curve. The lines of the SRSI indicator can be seen still falling sharply into the oversold region of the indicator. Consequently, this market seems aligned for more downward retracement toward the $0.1200 or perhaps a lower $0.1100 price level.