Dogecoin (DOGE) Price Prediction: DOGE/USDT Sees a Shift to Continue Upside Move
Estimated Reading Time: 2 minutes
Don’t invest unless you’re prepared to lose all the money you invest. This is a high-risk investment and you are unlikely to be protected if something goes wrong. Take 2 minutes to learn more
Date: January 12, 2026
The Dogecoin market has experienced a sustained upside retracement in recent sessions. However, a modest correction recently pushed price action toward lower levels. Nevertheless, today’s trading session has introduced another shift in price direction, suggesting a potential continuation of the broader upward move.
DOGE/USDT Long-Term Trend — Bullish (Daily Chart)
Key Price Levels
Resistance: $0.1500, $0.1600, $0.1700
Support: $0.1400, $0.1300, $0.1200
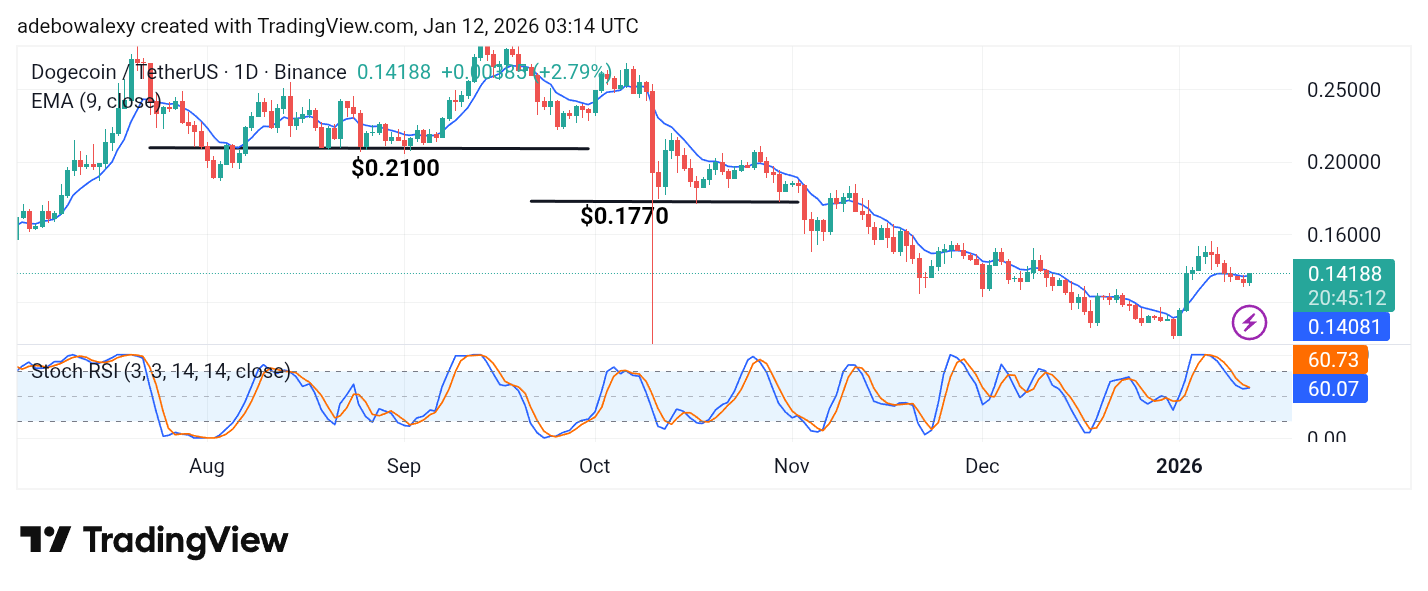
The ongoing session has opened bullish, with price action pulling back to the upside. As a result, the latest price candle has pushed DOGE back above the 9-day Exponential Moving Average (EMA). The Stochastic Relative Strength Index (SRSI) lines are converging for a potential upside crossover around the 60 level, which aligns with a possible bullish recovery.
Dogecoin (DOGE) Price Prediction: DOGE/USDT Bulls Bounce Back Into Action
Over the past week, the Dogecoin market retraced to lower price levels, a move that dragged price action below the 9-day EMA curve. However, the current session has returned trading activity above the EMA, marking a notable shift from last week’s trend.
The convergence of the SRSI indicator lines further confirms this change in momentum, suggesting that price action may experience additional upward movement going forward.
Dogecoin (DOGE) Price Prediction: DOGE/USDT Snaps Back Above the $0.1400 Support (4-Hour Chart)
The 4-hour Dogecoin chart provides further insight into recent market behavior. The latest price candle appears significantly larger than the previous one. Similar to the daily chart, trading activity is also positioned above the 9-day EMA curve.
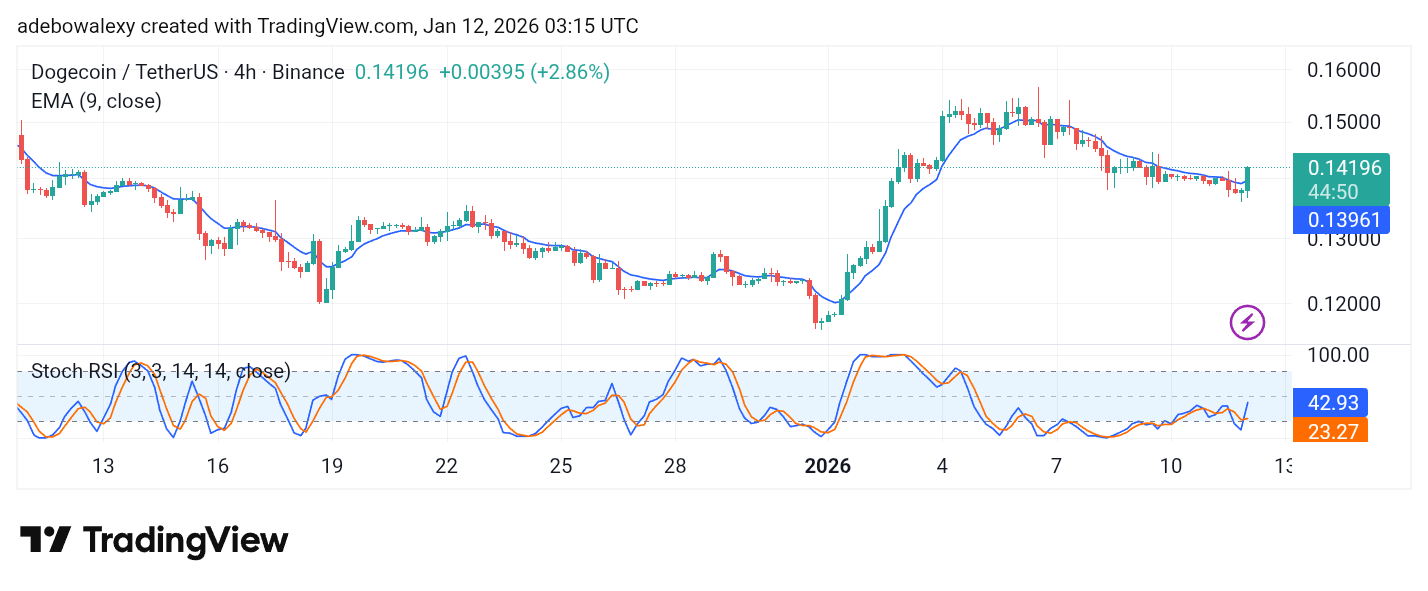
In addition, the SRSI indicator lines have already completed an upside crossover, with the indicator now trending upward. This confirms that price action may resume its upward trajectory toward the $0.1550 level and possibly the $0.1600 price level.