Solana (SOL) Price Prediction: SOL/USDT Hangs Above $220 by a Whisker
Estimated Reading Time: 3 minutes
Don’t invest unless you’re prepared to lose all the money you invest. This is a high-risk investment and you are unlikely to be protected if something goes wrong. Take 2 minutes to learn more

Date: October 10, 2025
The Solana market has maintained its general upward trend that began in June this year. Although the market is currently experiencing what seems like a short consolidation phase, it remains at an elevated support level.
Long-Term Trend — Bullish (Daily Chart)
Key Price Levels:
Resistance: $230, $240, $250
Support: $220, $210, $200
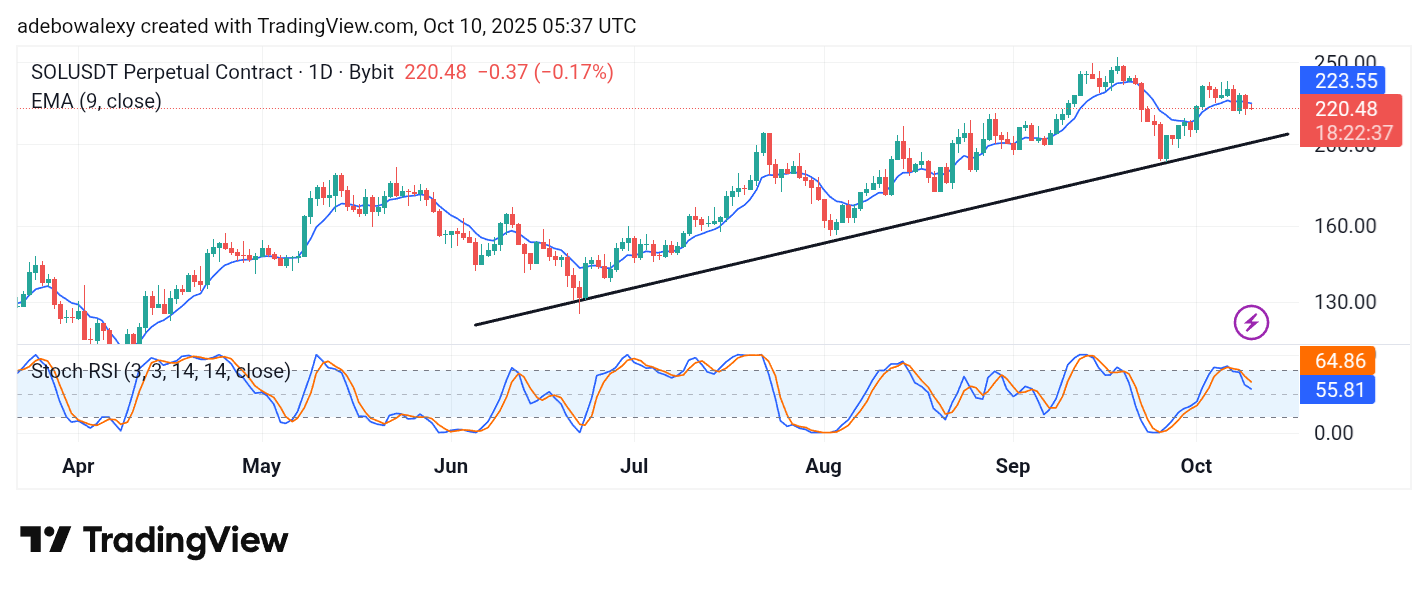
Over the past three sessions, it is evident that Solana’s price activity has been maintaining a common base. However, the ongoing session has brought prices below the 9-day Exponential Moving Average (EMA) curve. The latest price candle appears red but is heavily compressed downward. The Stochastic Relative Strength Index (SRSI) indicator lines are above the 50 threshold but have a downward trajectory. Also, the lead line shows a deflection from its straight downward path at the terminal end of the SRSI indicator.
Solana (SOL) Price Prediction: Solana Bulls Seem to Be Mounting a Resistance
The Solana market has been under notable pressure from price forces. This is observable from the fact that price activity on the daily chart has maintained a consistent base. However, the market has fallen below the 9-day EMA line. Nevertheless, price action still holds above the $220 level—by a whisker.
The SRSI indicator lines show a downward trajectory above the 50 threshold. However, it is worth noting that the lead line of the SRSI has a slight deflection to the side, aligning with the compressed appearance of the last price candle on the daily chart. Therefore, it seems the market may be preparing for a bounce off the $220 threshold.
Solana (SOL) Price Prediction: SOL/USDT Shows Mixed Outlook (4-Hour Chart)
Looking at the Solana market on the 4-hour chart, price action can be seen hugging the 9-day EMA curve. However, the latest price candle appears below the EMA line, suggesting a downward rebound off the ceiling formed by the EMA.
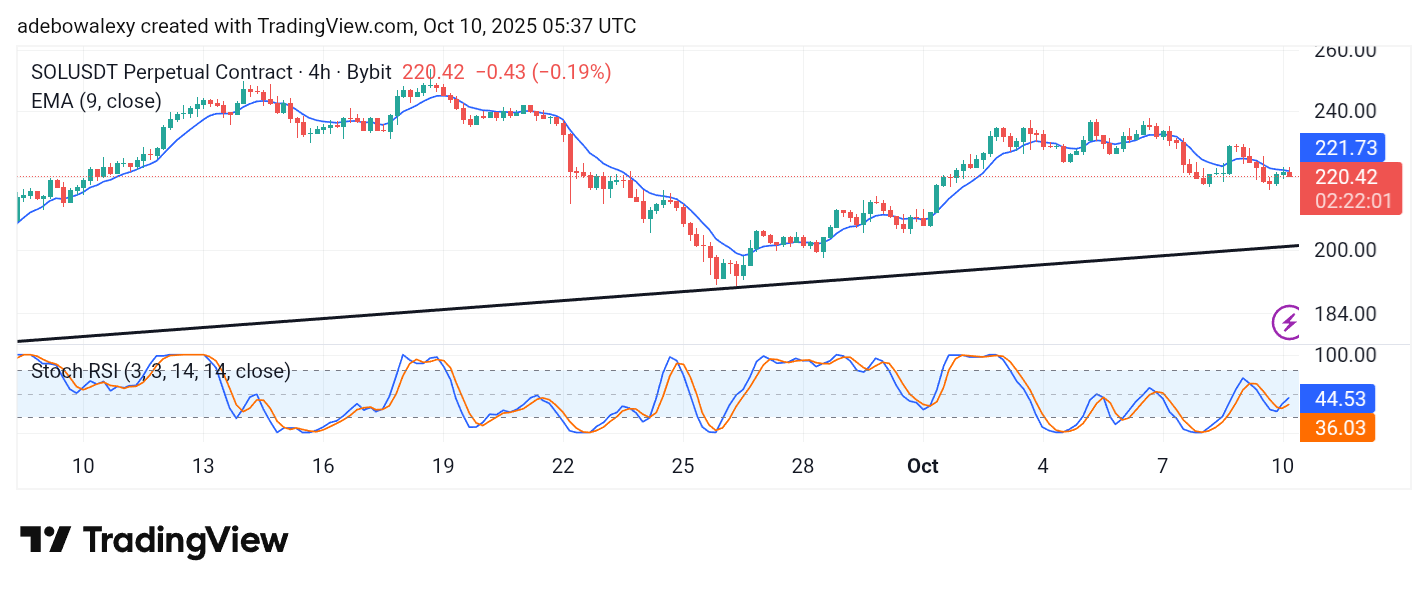
Be that as it may, the lines of the SRSI indicator continue to maintain their sharp upward movement since the previous upward crossover. At this point, the market presents mixed indications; therefore, traders might want to wait for a clear breakout above the resistance formed by the 9-day EMA curve before aiming toward the $225 level for short-term gains.