Bitcoin (BTC/USD) Tests the Immediate $40,000 Resistance
Estimated Reading Time: 3 minutes
Don’t invest unless you’re prepared to lose all the money you invest. This is a high-risk investment and you are unlikely to be protected if something goes wrong. Take 2 minutes to learn more
Bitcoin Price Prediction – May 26
The market operation of Bitcoin and the US Dollar now converges around the levels of $40,000 and $35,000. The higher value earlier mentioned has only being tested about a couple of three days’ sessions from below. The crypto market is trading at about a 0.86% increase at around the point of $38,364.
BTC/USD Market
Key Levels:
Resistance levels: $40,000, $45,000, $50,000
Support levels: $35,000, $30,000, $25,000
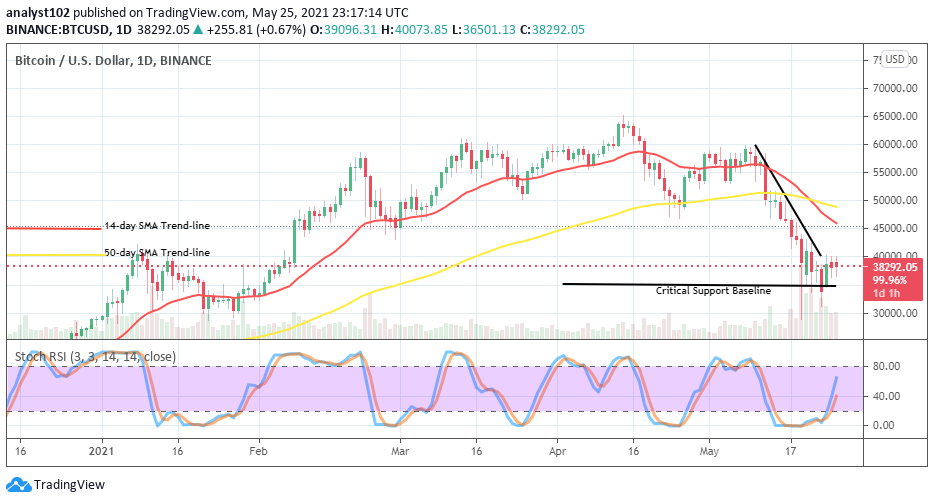
BTC/USD – Daily Chart
The points of $40,000 and $35,000 have now become two important trading lines as depicted on the BTC/USD daily chart currently. The last time the crypto saw a drawdown past the lower level was on May 23. After touching support below it, in the preceding day, price emerged with a bullish candlestick bottoming on the support line of the lower point firstly mentioned earlier on. The 50-day SMA indicator remains been crossed to the southbound by the 14-day SMA trend-line as the bearish trend-line drew downward to place a mark on the immediate resistance level. At the same time, a baseline is drawn to mark a critical support line. And, those drawn lines are in the taking of values in line with those points mentioned at the beginning of this analysis paragraph. The Stochastic Oscillators have swerved the hairs to the north from the oversold region to point towards the north a bit over range 40. That suggests the possibility of seeing a return of an upswing in this market soon.
How long will the BTC/USD test the $40,000 resistance level?
As the BTC/USD has seemingly embarked on a rebounding movement, the crypto price presently encounters resistance at the point of $40,000. As a result, the point has only been tested from below making a further upsurge in the crypto market un-smoothly. However, bulls still appear taking their time below that level to, later on, come up stronger in their capacity building against some of the previously forces inflicted on it by the US fiat currency.
In the continuation of the downward forces of this market, bears yet have to consolidate their presence around the immediate resistance level of $40,000. But, a fearful breakout of that level will potentially put most sell orders in danger of losing their positions to an upside. Therefore, to avoid just that, traders need to exercise some degrees of cautiousness before placing an entry.
BTC/USD 4-hour Chart
The medium-term chart reveals that all the SMA trend lines are still pointing in the downward direction to indicate that the valuation of BTC/USD is yet to come out of falling pressure. The 14-day SMA trend-line is underneath the 50-day SMA indicator as the bearish trend-line drew a bit over the smaller SMA to indicate the point at which the current price is. The Stochastic Oscillators have slightly moved down out of the oversold region to now lightly cross the hairs in an attempt to the north closely below range 80. That suggests the probability of getting to seeing ups than downs in the next trading activities of this crypto economy.\
Note: new.cryptosignals.org is not a financial advisor. Do your research before investing your funds in any financial asset or presented product or event. We are not responsible for your investing results.