Polkadot (DOT/USDT) Halts Further Downtrend, Prepares for an Upside Bounce
Estimated Reading Time: 3 minutes
Don’t invest unless you’re prepared to lose all the money you invest. This is a high-risk investment and you are unlikely to be protected if something goes wrong. Take 2 minutes to learn more
Polkadot Long-term Analysis: Bearish
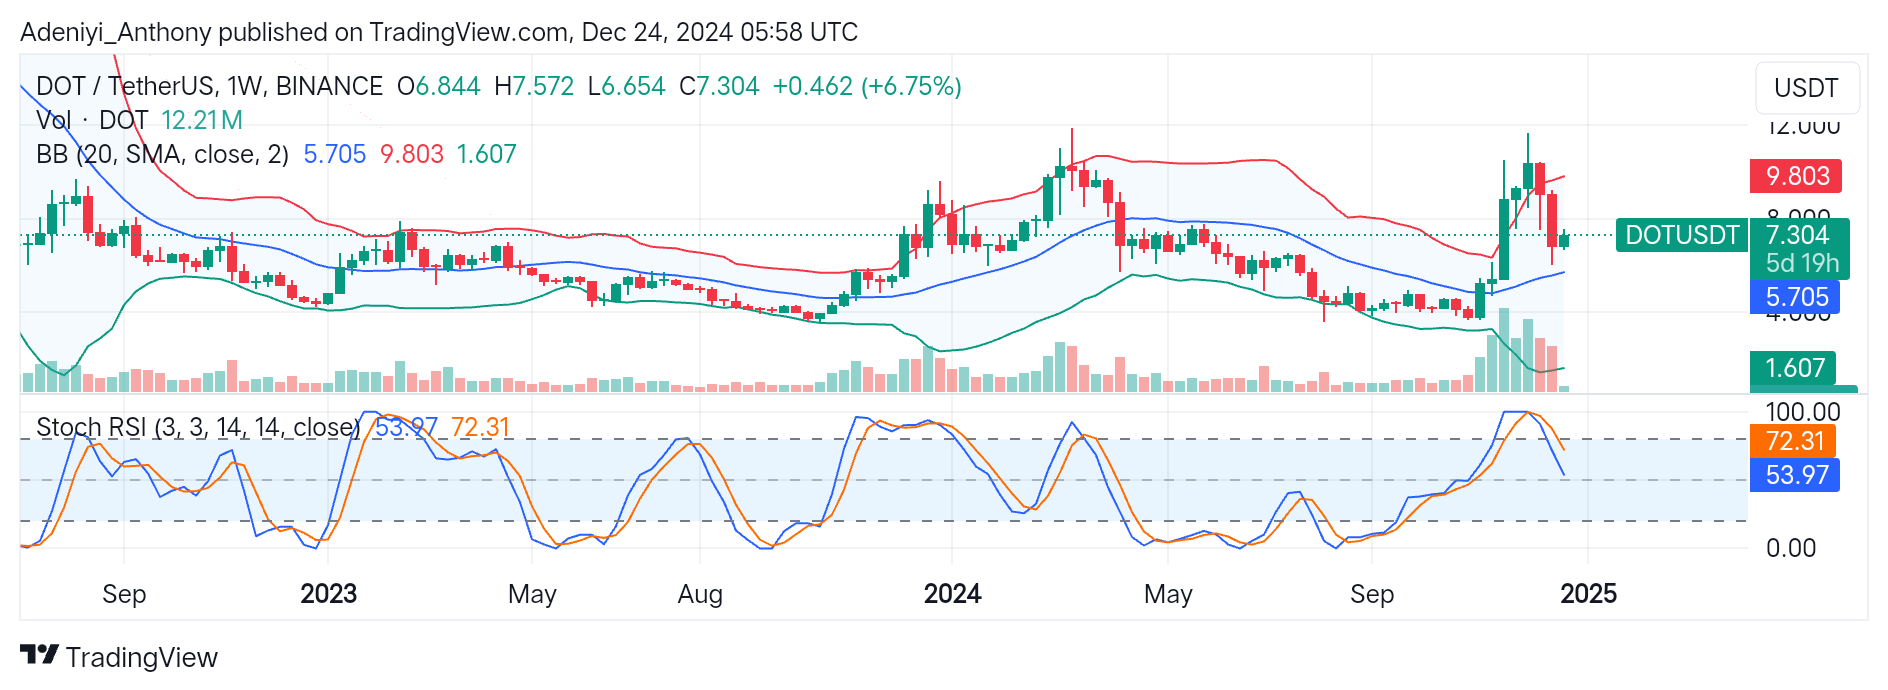
The weekly chart of the Polkadot against the Tether has displayed a bullish sentiment with an impressive 6.75% increase above the previous trading session. As the price bounces back from the lower Bollinger band, this indicates a high level of purchasing demand.
DOT/USDT earlier had a sharp drop in price as a result of a large sell-off that caused the price to drop from a recent high. Leaving traders to wonder if the current trend is genuine, though, the recent price action points to a bounce-back scenario.
Currently, DOT/USDT is trading at $7.304, with 12.21 million traded volumes for the week.
Technical Indicators
Major Resistance Levels: $7.800, $8.500, and $9.806
Major Support Levels: $ 7.000, $6.500, and $5.700
Polkadot Technical Analysis
The analysis of Polkadot on a weekly timeframe shows that DOT is displaying a sign of an upside-bounce potential with critical points at $7.800. While the current sentiment leans towards bullishness, caution is advised due to the overbought signal by the Stochastic RSI.
To this end, breaking above the $7.800 level could confirm a price recovery to the former high; otherwise, a dip below the $7.000 level may result in further retracement.
DOT/USDT Analysis: What to Expect
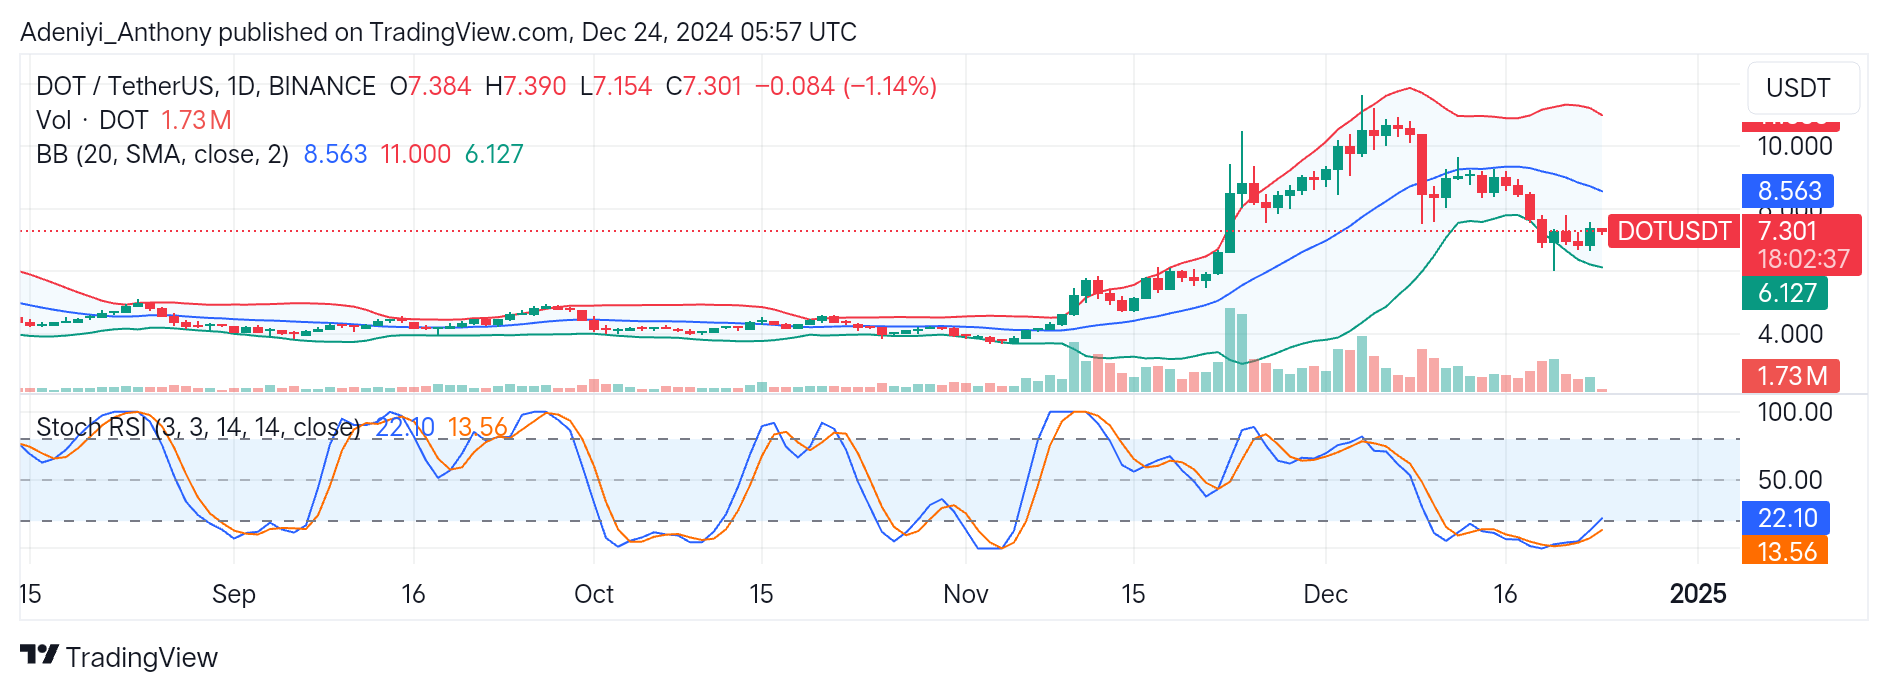
The analysis of DOT/USDT on the daily timeframe shows that the pair has been on a downtrend for some weeks, evidenced by the formation of lower lows. This suggests sellers’ dominance as price operates in the lower segment of the Bollinger bands.
Currently, DOT/USDT seems to be in a consolidation phase with an oversold momentum as the price hovers around the lower Bollinger band at $6.127. However, the widening of the Bollinger bands and the positioning of the Stochastic oscillator suggest a large price movement is on the horizon.
Therefore, a break above $7.154 could trigger a rebound toward $8.500, as the oscillator signals upside momentum.
If bullish traders don’t enter, sellers may drive the price down to $6.000.
You can purchase crypto coins here. Buy LBlock