Polkadot (DOT/USDT) Signals a Potential Pullback at $9.82 After a Strong Rally
Estimated Reading Time: 3 minutes
Don’t invest unless you’re prepared to lose all the money you invest. This is a high-risk investment and you are unlikely to be protected if something goes wrong. Take 2 minutes to learn more
Polkadot Long-term Analysis: Bullish
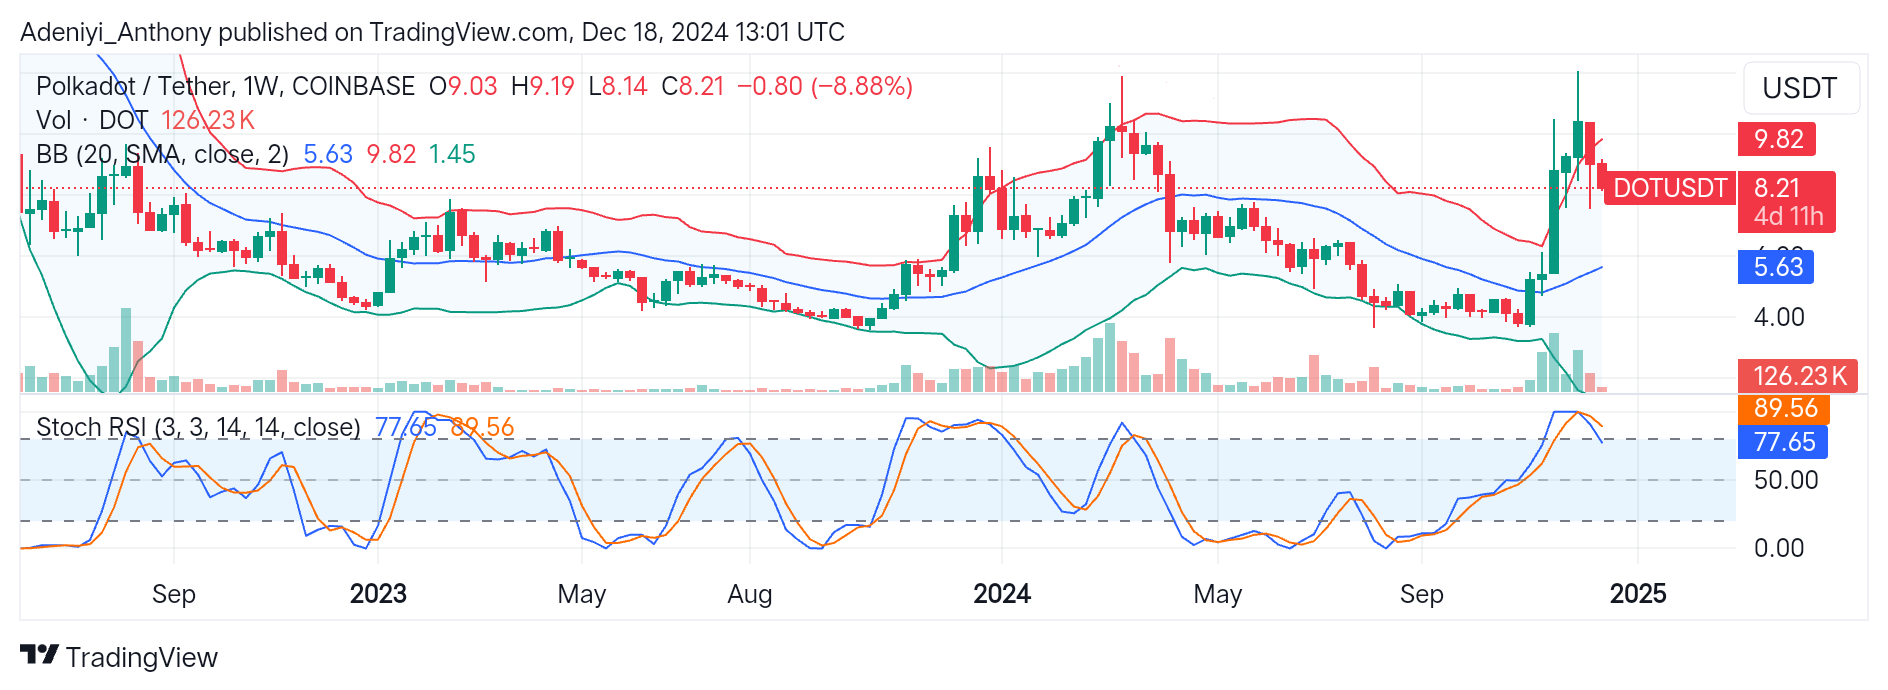
The weekly chart of Polkadot (DOT) against the Tether (USDT) has shown a sharp upward movement followed by a retracement after a period of overextended upside trajectory since late September. This marks the significant gains recorded by the pair. However, since hitting the peak around $9.82, the pair is now back to the current level, aiming at the mid-Bollinger band. This movement signals a potential short-term pullback might be on the horizon.
Also, the analysis captures the current expansion of the Bollinger bands, indicating increased volatility. However, the positioning of the oscillator at the bottom of the chart suggests a cool-off as the pair seems to be near overbought.
Currently, Polkadot trades at $8.21 with a weekly traded volume of 126.23k.
Technical Indicators
Major Resistance Levels: $9.82, $10.50, and $12.00
Major Support Levels: $8.00, $6.50, and $5.63
Polkadot Technical Analysis
With the previous breakout at the $6.00 level, Polkadot against the Tether has experienced a surge in price towards $9.82. However, the current resistance seems to be strong as the pair is currently on a decline. Though the price of the pair is declining, an uptrend is expected if the $8.21 level is maintained with increased volume; otherwise, a breakdown from the mid-line would invalidate the bullish trend.
At the bottom of the chart, the Stochastic RSI suggests the price is cooling off, and a dip below the overbought region would confirm the bearish movement. To this end, traders should wait for a break below the $8.00 psychological level for a downtrend, while a break above the $9.82 level would indicate the continuation of the bullish trend.
DOT/USDT Analysis: An Uptrend or Continued Downtrend?
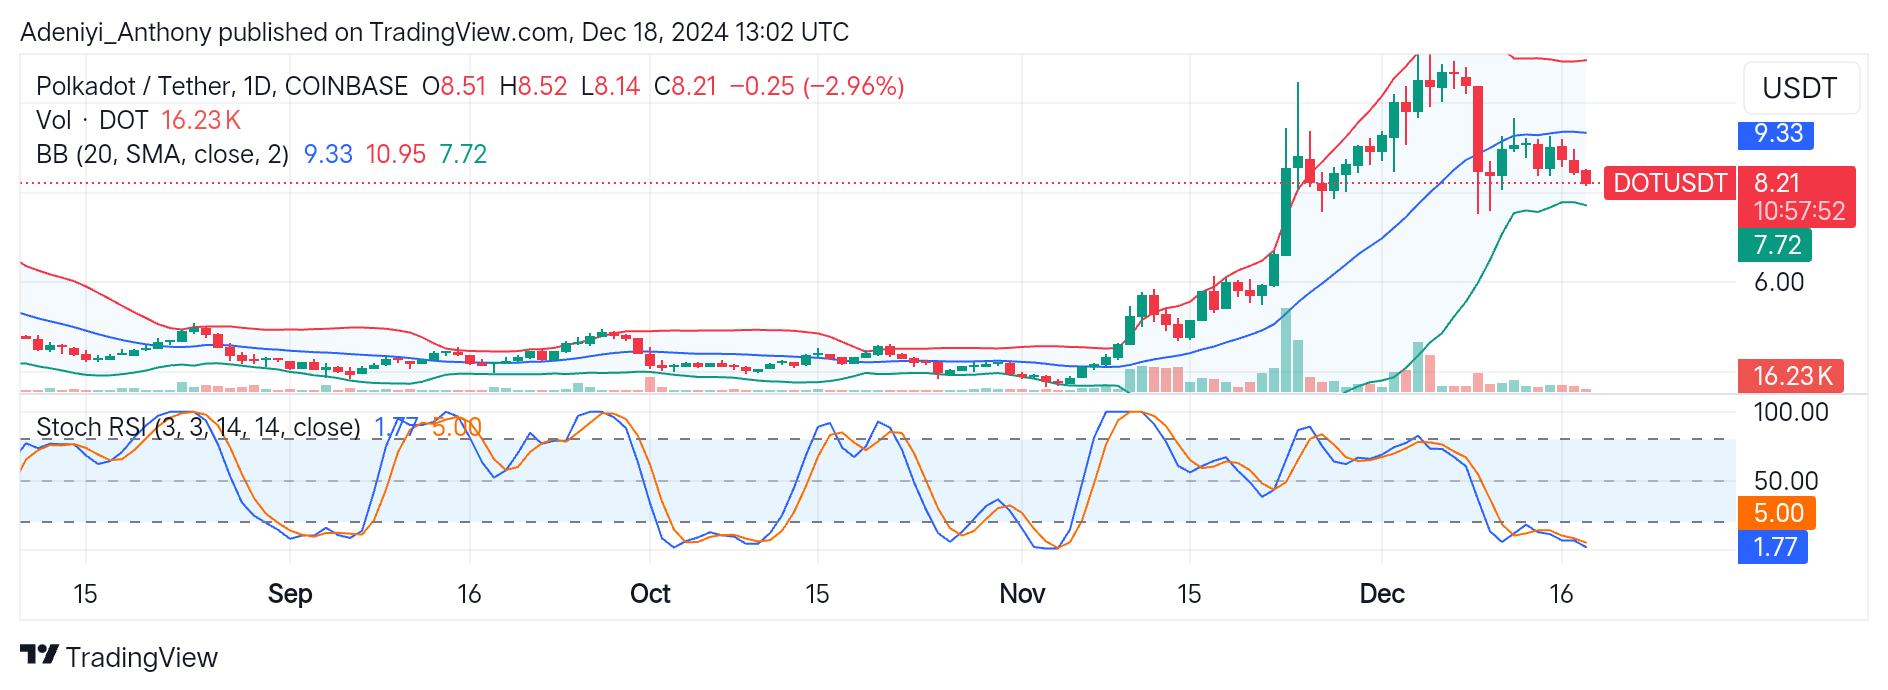
On the daily timeframe, DOT/USDT had reached a significant height in October. However, the price seems to be consolidating since dropping below the mid-band at $9.33 earlier this month.
Recent price actions on the daily chart show that the pair’s price is ranging after dropping below the mid-band due to significant profit-taking actions.
Additionally, the Stochastic RSI shows that the pair operates deep in the oversold region. However, a reversal to the North could be made if the lines make a bullish crossover; otherwise, the price may continue the range-bound movement or experience further dips. To this end, a rebound may occur soon, provided key support at $7.72 is strong.
You can purchase crypto coins here. Buy LBlock