SPONGE/USD ($SPONGE) Establishes $0.00011 as a Strong Support Level
Estimated Reading Time: 3 minutes
Don’t invest unless you’re prepared to lose all the money you invest. This is a high-risk investment and you are unlikely to be protected if something goes wrong. Take 2 minutes to learn more
The $SPONGE market has identified the $0.00011 price level as a significant milestone, potentially transforming it into a robust support level capable of sustaining a bullish trajectory. Over the past few days, market participants, both bulls and bears, have engaged in a struggle around this critical price point. This extended period of consolidation is poised to fortify the level’s credibility as a supportive element for bullish sentiment.
One compelling rationale behind the prospect of $0.00011 becoming a bullish support level lies in the scenario where the bearish momentum initiated near the $0.00012 price level may find itself ensnared within the confines of a sideways market. Over time, this bearish force may wane within the rangebound market, presenting an opportunity for the bulls to assert their influence and guide the market upwards.
Key Price Levels
- Resistance: $0.000115, $0.000120, and $0.000125.
- Support: $0.000090, $0.000080, and $0.000085.
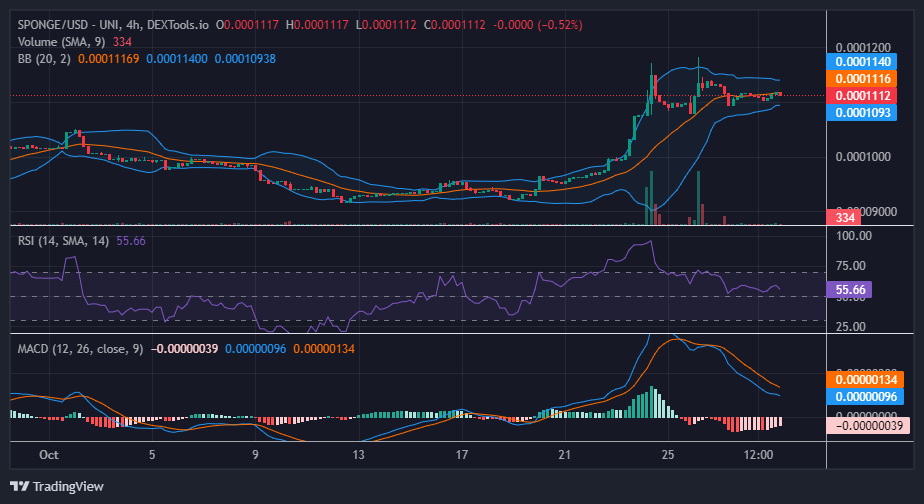
SPONGE/USD ($SPONGE) Price Analysis: Technical Insights
As the $SPONGE market sustains a sideways trajectory, the Bollinger Bands are exhibiting convergence around the ranging price action. This convergence signifies an impending directional move, which could manifest either upside or downside.
Examining the Relative Strength Index (RSI), it consistently hovers around the 55 level. This suggests that, despite the market’s sideways movement, bullish sentiment remains dominant; however, the bullish momentum is not exceptionally robust. Notably, the fact that the market maintains an RSI level above 50 indicates a propensity for an upward breakout.
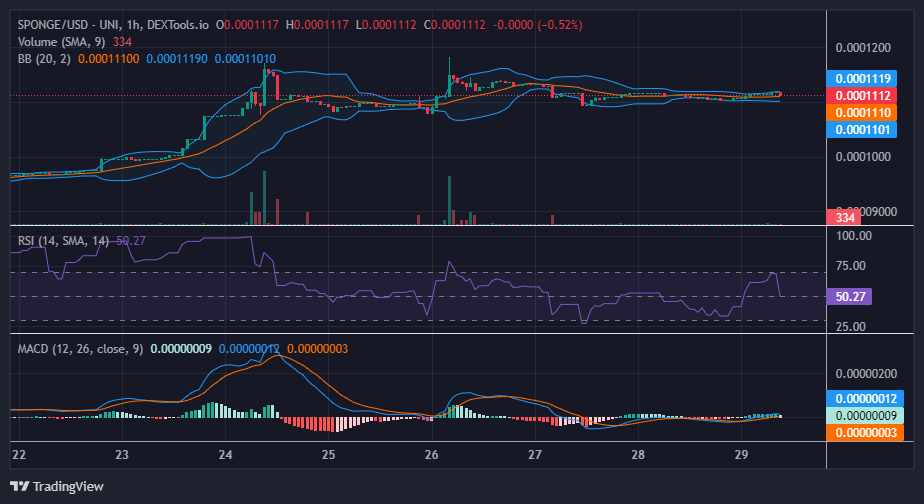
Short-Term Outlook on SPONGE/USD: 1-Hour Chart
On the 1-hour chart, the Bollinger Bands have contracted, indicating the formation of a converging and narrowing price channel, accompanied by a decrease in volatility. Simultaneously, the Relative Strength Index (RSI) on the 1-hour timeframe depicts a retracement towards the midpoint, signaling a state of equilibrium. This could potentially signify that the current price level, championed by the bulls, may have solidified as a credible support level.
Stake your $SPONGE in three days to start reaping the benefits!
⏰ It’s crunch time, #SPONGERS! 🚀
In 3 days, stake your $SPONGE and watch the rewards ripple in! 🧽💧
🌟 Staking goes live on November 1st.
Get ready 🧽🧽🧽🧽🧽#SpongeStaking #Crypto #Web3 pic.twitter.com/SRjmohM8xe
— $SPONGE (@spongeoneth) October 29, 2023
Invest in the hottest and best meme coin. Buy Sponge ($SPONGE) today!