SPONGE/USD Technical Analysis: Bullish Trends Poised for Further Gains
Estimated Reading Time: 3 minutes
Don’t invest unless you’re prepared to lose all the money you invest. This is a high-risk investment and you are unlikely to be protected if something goes wrong. Take 2 minutes to learn more
In the recent SPONGE/USD market assessment, we detected a surge in bullish activity around the $0.00011 level, following a modest pullback from the $0.000116 peak. As expected, our prior analysis foresaw the need for establishing a support level above $0.00011 to sustain the ongoing bullish momentum. This upbeat sentiment is underlined by the emergence of higher lows and the establishment of a fresh support level at approximately $0.0001123, reinforcing the upward trajectory in the bullish market.
Key Price Levels
- Resistance: $0.000115, $0.000120, and $0.000125.
- Support: $0.000090, $0.000080, and $0.000085.
Sponge (SPONGE/USD) Price Analysis: Technical Insights
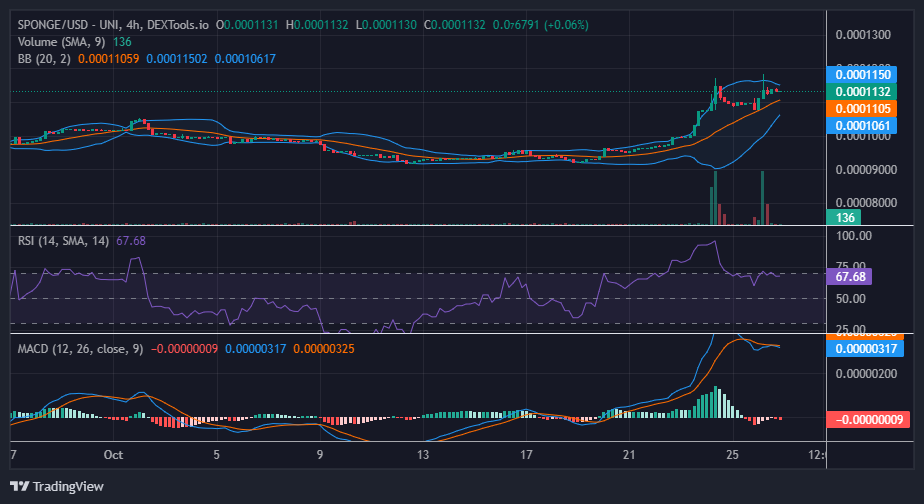
Analyzing the current market dynamics, we identify a substantial resistance obstacle at the $0.0001150 price mark. This resistance factor has been instrumental in tempering market enthusiasm after the bulls successfully secured support at $0.0001123. The ongoing tussle with this resistance is now at a pivotal juncture, with the potential for the bullish trend to persist if the new higher support level holds firm.
Our technical analysis also highlights the Bollinger Bands, which are currently converging around the $0.0001132 price point. This convergence pattern suggests the likelihood of an imminent upward breakout in the market. These technical indicators collectively underscore the prevailing bullish sentiment within the SPONGE/USD market. Notably, the Relative Strength Index (RSI) is approaching overbought territory at 57.61, a reflection of the robust bullish sentiment with potential for continued price appreciation.
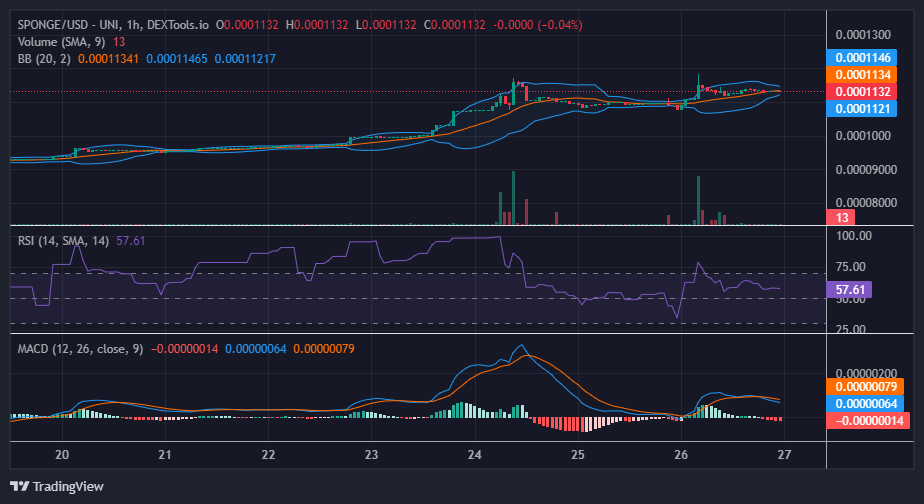
Short-Term Outlook: 1-Hour Chart
Zooming in on the 1-hour chart, we observe a consolidation phase centered around the $0.0001132 price level. This consolidation corresponds closely with the 20-day moving average, signaling a state of equilibrium, in line with Bollinger Bands’ indications. Simultaneously, the RSI maintains consistent momentum at 57.61, firmly positioning itself within bullish territory, further reinforcing the prevailing optimistic outlook.
Prepare to stake your $SPONGE and watch as prizes start to pour in!
🌊 6 days to go, #SPONGERS! 🚀
Get set to stake your $SPONGE and let the tide of rewards flow! 🧽🌊#SpongeStaking #Countdown #Alts pic.twitter.com/HIvBRh8Jay
— $SPONGE (@spongeoneth) October 26, 2023
Invest in the hottest and best meme coin. Buy Sponge ($SPONGE) today!