Polkadot Is Range Bound as It Trades Below $10
Estimated Reading Time: 2 minutes
Don’t invest unless you’re prepared to lose all the money you invest. This is a high-risk investment and you are unlikely to be protected if something goes wrong. Take 2 minutes to learn more

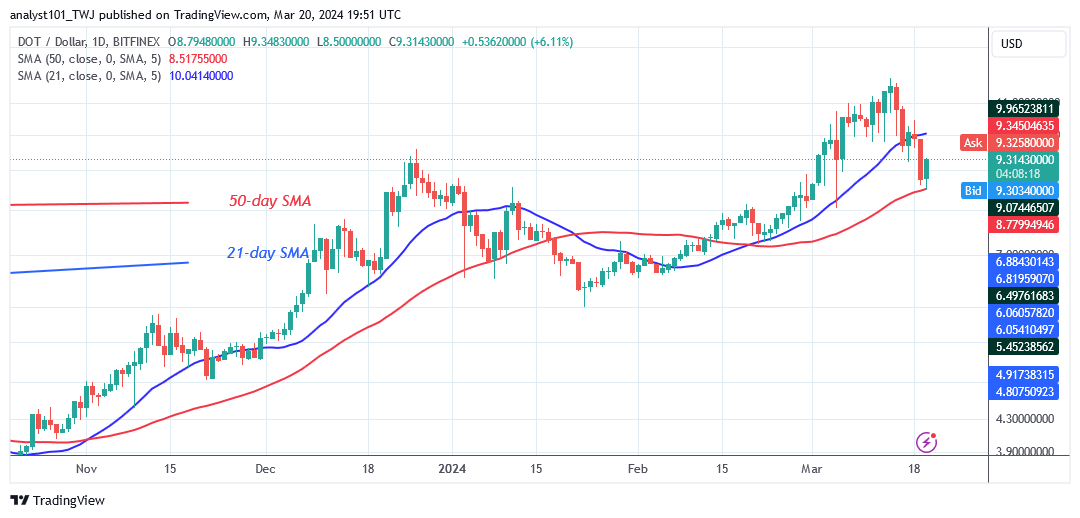
Polkadot (DOT) Long-Term Analysis: Bearish
Polkadot’s (DOT) upward trend has ended as it trades below $10. The cryptocurrency asset fell below its moving average lines but halted above the 50-day SMA. The bearish momentum has broken below the breakthrough mark of $9.58 and the 21-day SMA. The drop has halted above the 50-day SMA, with bulls buying the dips. Polkadot is currently worth $9.39.
The cryptocurrency price has been caught between the moving average lines. It is currently trading at a price range of $8.50 to $10.00. The DOT price is rising and will resume a bullish trend if buyers push it above the 21-day SMA. The cryptocurrency will recover to its prior high of $11.85. However, if the altcoin falls below the 50-day SMA, the market will reach its bottom of $8.00.
Technical indicators:
Major Resistance Levels – $10, $12, $14
Major Support Levels – $8, $6, $4
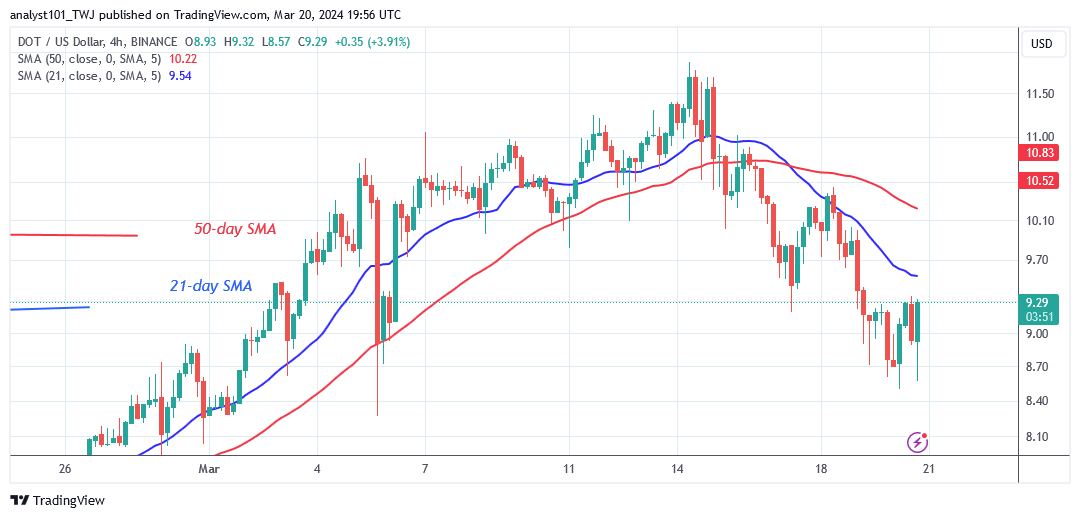
Polkadot (DOT) Indicator Analysis
The price movement has been limited because the cryptocurrency’s price is caught between the moving average lines. The initial dip has paused above the 50-day SMA, allowing the altcoin to resume its upward trend. On the 4-hour chart, the price bars are below the moving averages. The 21-day SMA acts as a resistance to the price bars.
What Is the Next Direction for Polkadot (DOT)?
Polkadot is dropping below the moving average lines as it trades below $10. The 21-day SMA is reversing the upward correction, forcing the cryptocurrency to retreat. The altcoin is currently trading between $8.50 and $10.00 as a result of the recent decline. The crypto signal will stay range-bound till the altcoin begins its uptrend.
You can purchase Lucky Block here. Buy LBLOCK
Note: Cryptosignals.org is not a financial advisor. Do your research before investing your funds in any financial asset or presented product or event. We are not responsible for your investing results