Polygon (MATIC) Price Prediction: MATIC Continues to Consolidate at the $0.6680 Mark
Estimated Reading Time: 3 minutes
Don’t invest unless you’re prepared to lose all the money you invest. This is a high-risk investment and you are unlikely to be protected if something goes wrong. Take 2 minutes to learn more

Polygon (MATIC) Price Prediction, May 12
The support level at the $0.6680 price seems quite strong. This opinion stems from the fact that price action has been consolidating above this price mark, hitting it on several occasions without being able to break it down. This seems fascinating.
MATIC/USDT Long-term Trend: Bullish (Daily Chart)
Key Levels
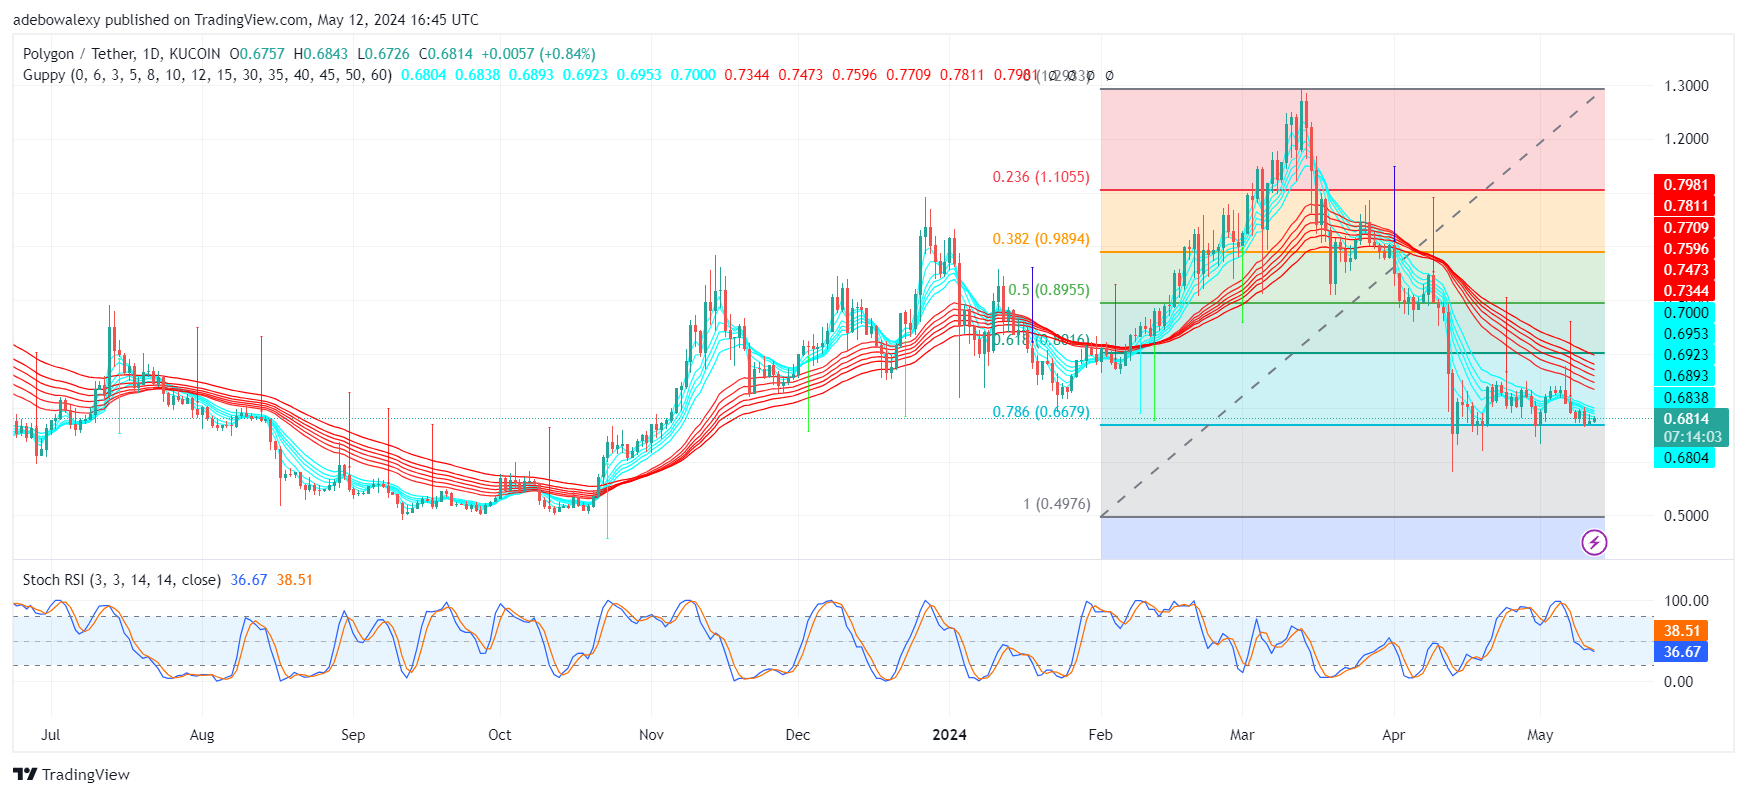
Resistance Levels: $0.7000, $0.9000, and $1.1000
Support Levels: $0.6600, $0.6400, and $0.6200
MATIC Daily Chart
The Polygon market has shown a lack of significant push at the $0.6780 price level. However, a tiny rebound has occurred since the previous session of the mentioned support, and the current session has maintained the trend. However, the size of the price candle for the current and previous sessions shows that the market lacks volatility. The current session has only placed the price of this token above one out of the five lines of the Guppy Multiple Moving Average (GMMA) indicator lines. Meanwhile, the Relative Strength Index (RSI) lines can be seen to have converged as they orient toward the oversold region.
Polygon Price Prediction: Will the MATIC Upside Correction Continue?
The movement of price action in the MATIC daily market isn’t as encouraging as it could be. The appearance of the last two green price candles has suggested that the market only managed to print minimal profits. While the current session continues below some of the GMMA indicator lines, this maintains that headwinds may still cause traders to lose their profits.
Additionally, the trajectory of the RSI indicator lines suggests that the support at the $0.6780 price level may be tested shortly. However, in the meantime, the token is printing only minimal gains, and traders can only hope that the trend continues.
MATIC/USDT Medium-term Trend: Polygon’s Minimal Upside Correction Is Trying to Stay on (4H Chart)
The Polygon 4-hour market may be revealing that the little light of this upside correction is making a consistent effort to stay on. By inspection, it could be seen that price candles are crossing above more green GMMA lines. The last price candle on this 4-hour chart, though it seems to have contracted significantly, is still appearing green and above more GMMA Lines.
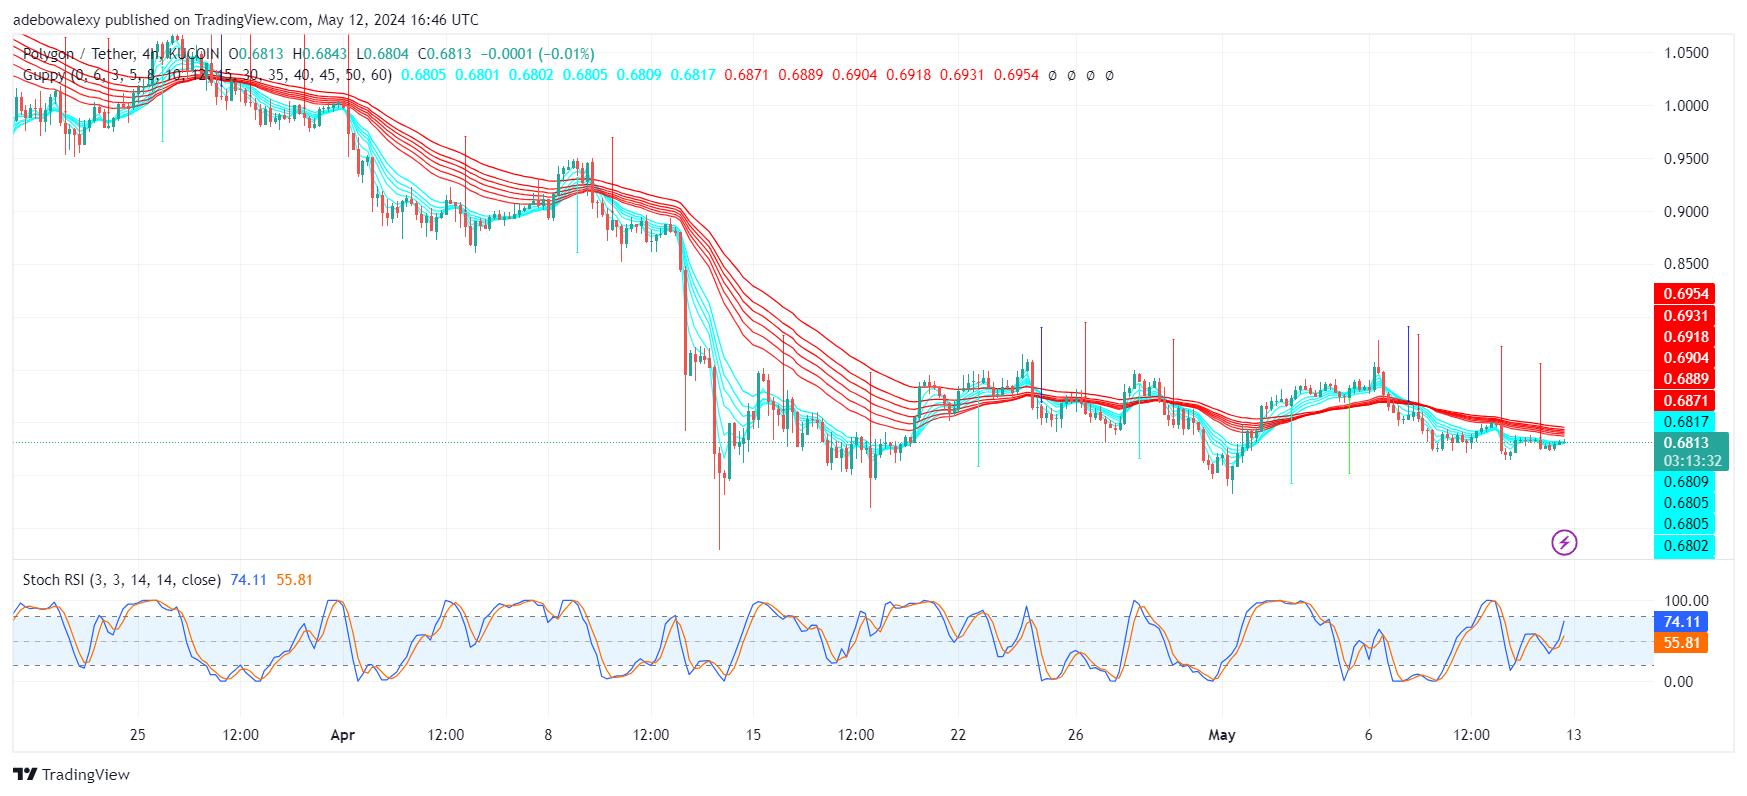
Meanwhile, the RSI lines are now rising upward into the overbought region. Although the appearance of the indicator lines seems a bit exaggerated, nevertheless, it maintains that upside forces are still active. Therefore, it holds that traders can still rely on the current trend only for minimal profit, perhaps around the $0.6900 mark.