Solana (SOL) Price Prediction: SOL Dips Towards the $140.00 Mark
Estimated Reading Time: 3 minutes
Don’t invest unless you’re prepared to lose all the money you invest. This is a high-risk investment and you are unlikely to be protected if something goes wrong. Take 2 minutes to learn more

Solana (SOL) Price Prediction, May 10
Despite Solana’s market resurgence above the $140.00 mark, price activity has yet to gain sufficient traction to convincingly break the $150 price level. Currently, technical indicators aren’t showing too many optimistic signs about the market’s direction.
SOL/USDT Long-term Trend: Bullish (Daily Chart)
Key Levels
Resistance Levels: $150.00, $170.00, and $190.00
Support Levels: $140.00, $120.00, and $100.00
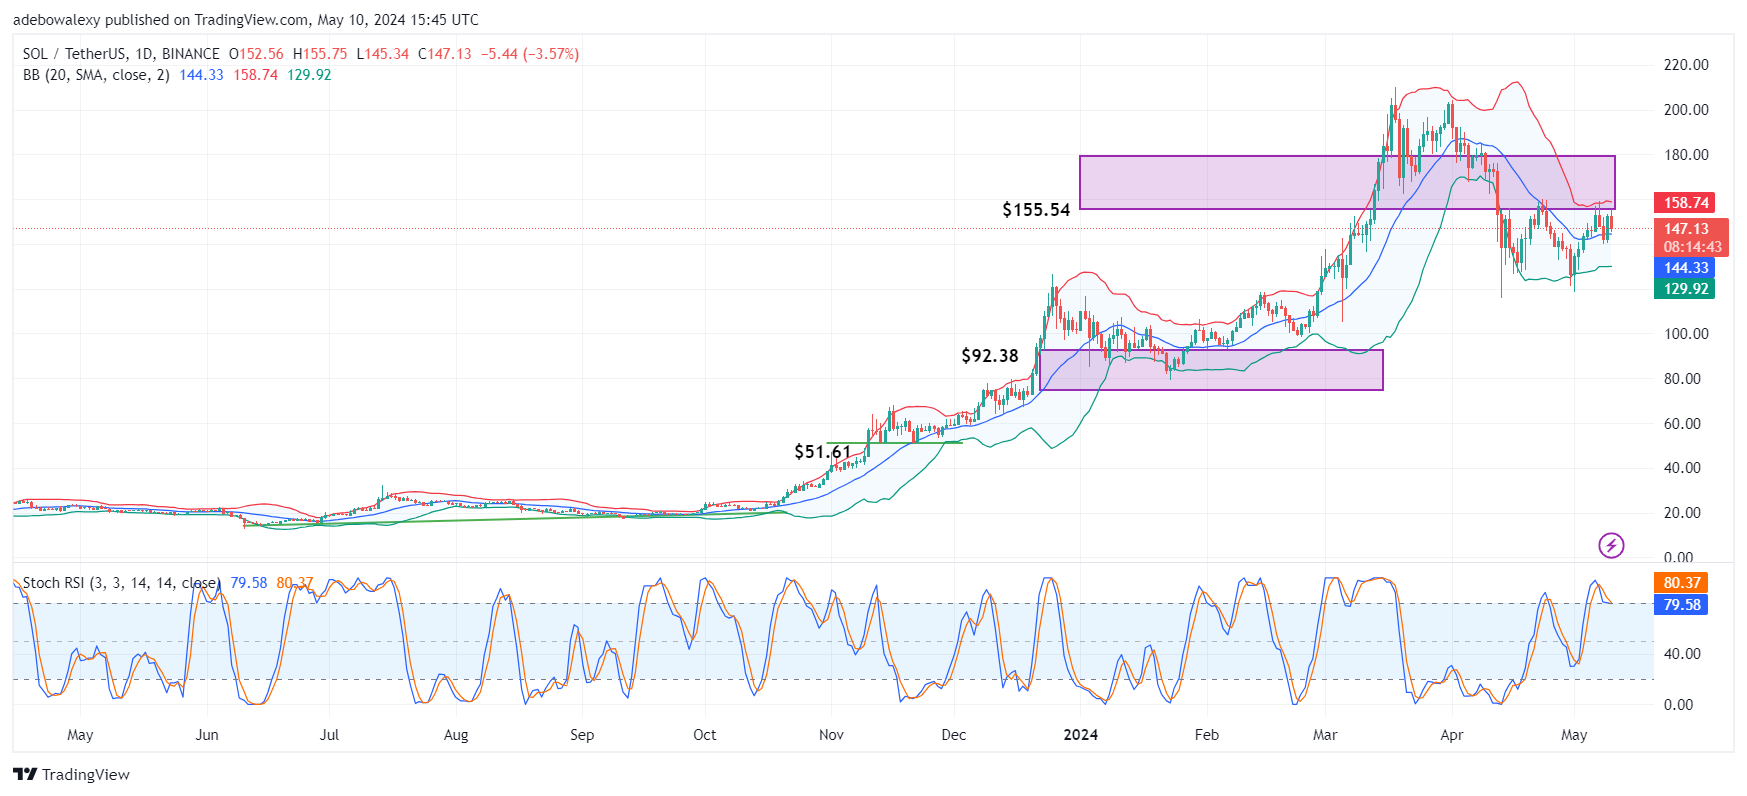
Price action in the Solana daily market has been hovering around the middle limit of the Bollinger Bands. Generally, the market has oscillated between the $150.00 and $140.00 price levels over the past 4–5 trading sessions. The last session showed a moderate price increase, raising the market back above the middle limit of the indicator. However, it should be noted that the Stochastic Relative Strength Index (SRSI) line has converged at the 80 mark of the indicator.
Solana Price Prediction: What Can We Hope to See in this Market?
Based on indications from the applied technical indicators in the Solana daily market, it’s apparent that the market lacks the momentum to break forth. The corresponding price candle for the current session is seen dipping towards the $145.00 price mark. Nevertheless, traders may view this psychological level as support for a potential rebound.
Meanwhile, the converged SRSI indicator lines suggest that the hope for a rebound seems plausible. This implies that an eventual crossover at this point may present resistance to further downward corrections in this market.
SOL/USDT Medium-term Trend: Upside Forces Are Presenting Some Resistance (4H Chart)
In the Solana 4-hour market, it’s revealed that the market experienced a steep dive in the ongoing session, erasing all previous gains accumulated over the past five sessions. At this point, the coin now trades below the middle limit of the Bollinger Bands indicator. Meanwhile, the Moving Average Convergence Divergence (MACD) lines are above the equilibrium level but are now seen converging for a crossover.
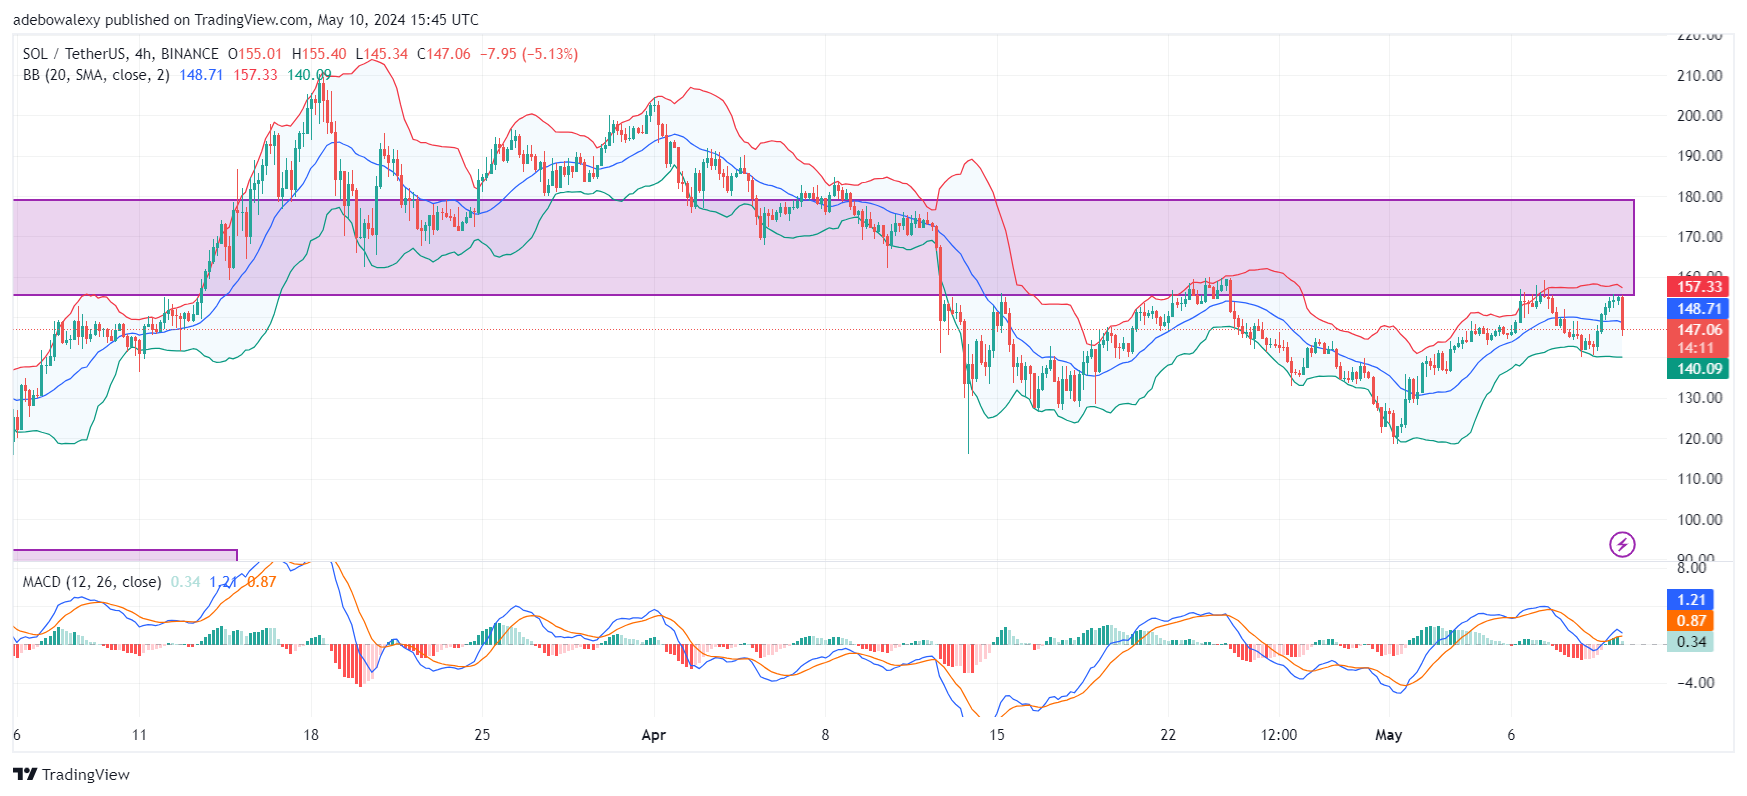
The appearance of a lower shadow on the last price candle on this chart suggests that a rejection is occurring from the support level. Nevertheless, since the market has fallen below the middle limit of the Bollinger Bands, it is safe to assume that the market may head towards support at the $140 mark.