Uniswap (UNI) Price Prediction: UNI Struggles to Break Through the $8.00 Barrier
Estimated Reading Time: 3 minutes
Don’t invest unless you’re prepared to lose all the money you invest. This is a high-risk investment and you are unlikely to be protected if something goes wrong. Take 2 minutes to learn more

Uniswap (UNI) Price Prediction – May 9
For the most of recent times, the Uniswap market has lacked significant traction. This is evident as the price action in this market hasn’t been able to break the gravitational pull below the $8.00 price level.
UNI/USDT Long-term Trend: Bullish (Daily Chart)
Key Levels
Resistance Levels: $8.00, $10.00, and $12.00
Support Levels: $7.00, $6.00, and $4.00
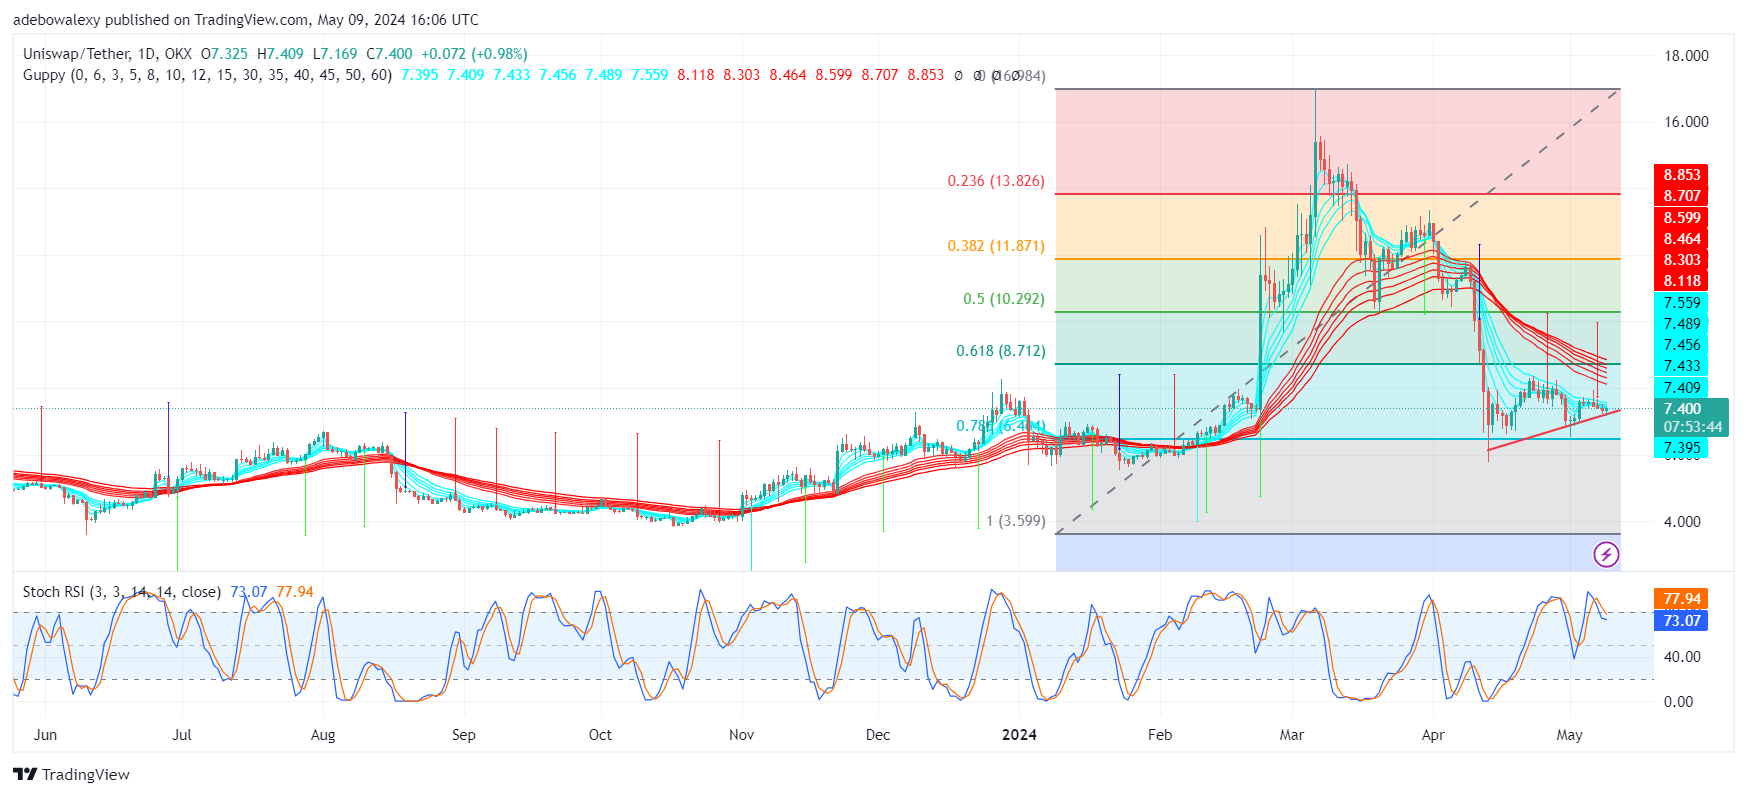
UNIUSDT Daily Chart
However, on a microscale, it appears that the market is forming higher highs. The last price candle on this chart suggests that price action may resume an upside correction from this point on. Meanwhile, the mentioned price candle positions the current price of the token above the first Guppy Multiple Moving Average curves. A deflection can also be observed on the leading line of the Stochastic Relative Strength Index (SRSI) indicator.
Uniswap Price Prediction: How Is the Uniswap Market Faring at the Moment?
From the signs on the Uniswap daily price chart, it is evident that the market still seems largely depressed. This observation stems from the fact that the gains printed on this market appear quite small. Furthermore, it stands at risk of being pushed down by headwinds.
However, the deflection seen on the SRSI indicator lines seems to indicate that upside momentum is building up. While this may seem small and negligible initially, it could develop further should more traders identify the current position of the market as a potential rebound point.
UNI/USDT Medium-term Trend: Uniswap Bulls Are Showing Resilience (4-H Chart)
Expanding the analysis of the Uniswap token to a 4-hour market, it is evident that buyers are also putting up a fight to move upwards. A new price candle has appeared on this chart, appearing green. Additionally, it has risen past the green set of the GMMA indicator lines. Trading activity in the UNI market is now occurring between the green and red lines of the GMMA indicator.
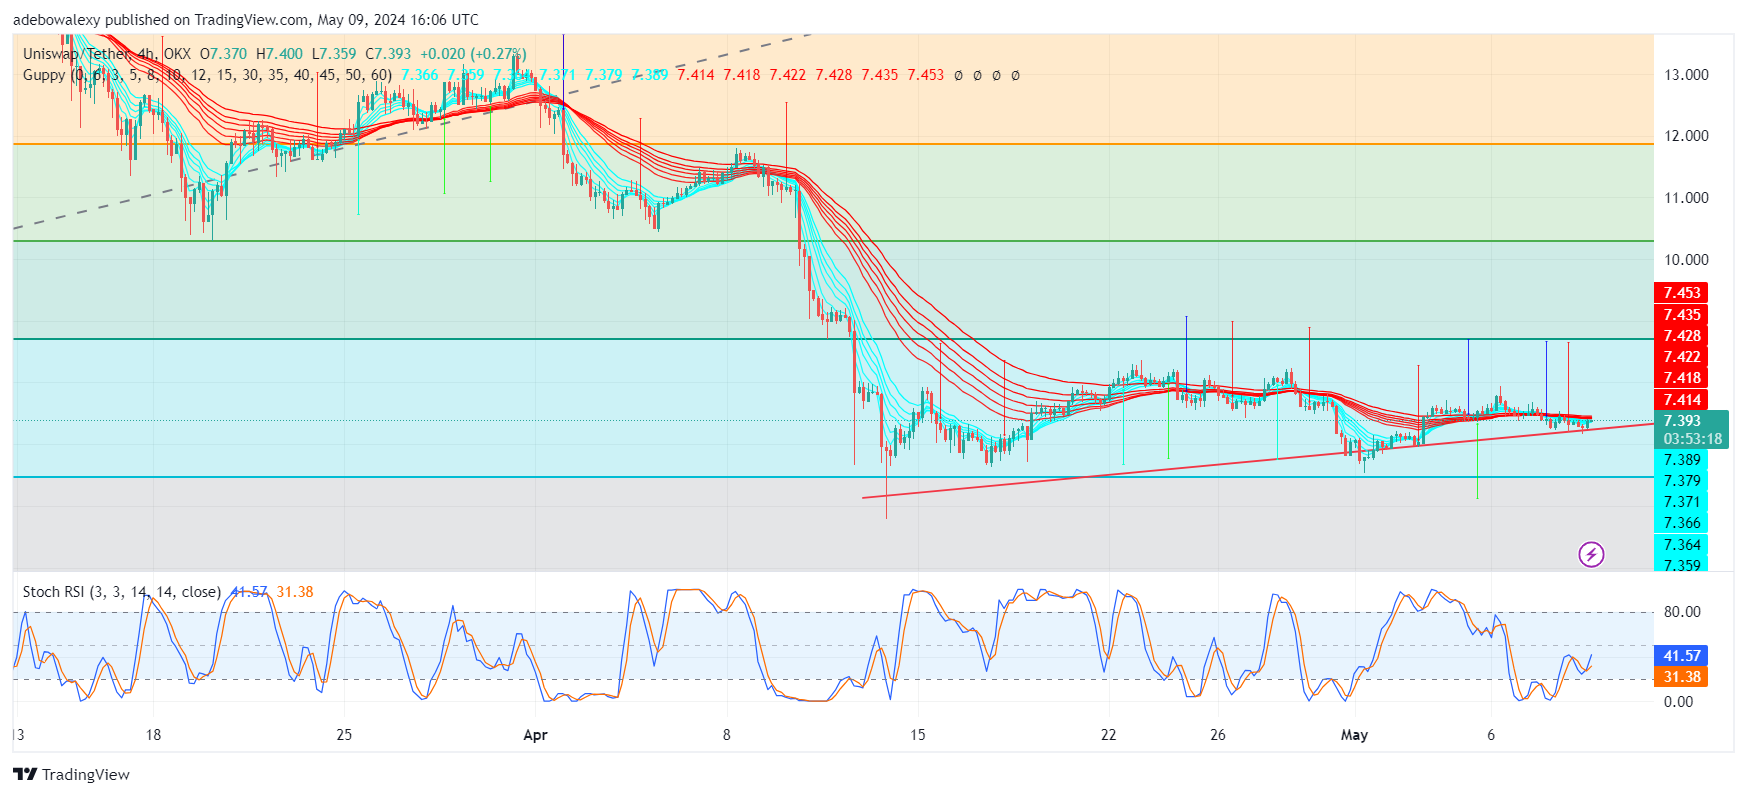
UNIUSDT 4-Hour Chart
Furthermore, the uptrend has been detected by the SRSI indicator. Consequently, the lines of this indicator have taken an upward path, further strengthening the hopes of a continued upward move in this market. Traders can still target a correction towards the resistance price mark at the $8.00 price level.