Bitcoin (BTC) Price Prediction: BTC May Experience Further Downward Corrections
Estimated Reading Time: 3 minutes
Don’t invest unless you’re prepared to lose all the money you invest. This is a high-risk investment and you are unlikely to be protected if something goes wrong. Take 2 minutes to learn more

Following the most recent steep dive in the Bitcoin market, which occurred last Wednesday, the king reclaimed support above the $60,000 price level. The token briefly crossed the $65,000 mark and then retreated below it.
BTC/USDT Long-term Trend: Bullish (Daily Chart)
Key Levels:
Resistance Levels: $65,000, $67,500, and $70,000
Support Levels: $60,000, $55,000, and $50,000
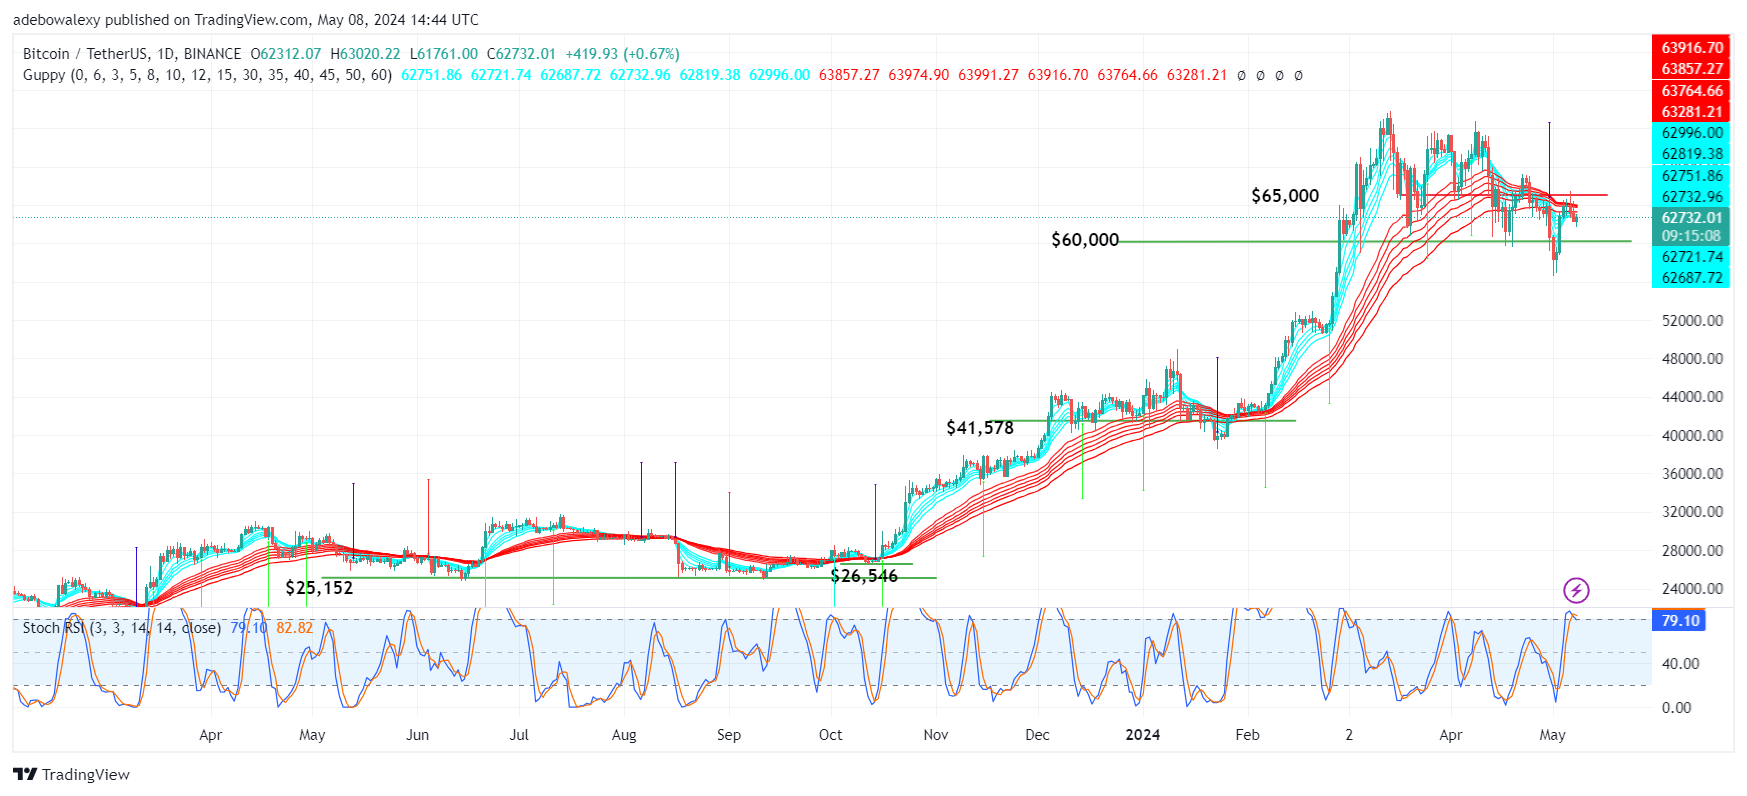
BTCUSDT – Daily Chart
Bitcoin, as earlier mentioned, has resumed trading above the $60,000 mark. At this point, the token has been making attempts to attain higher heights but has failed to do so due to a lack of significant traction. The last price candle here keeps prices above the lines of the green Guppy Multiple Moving Average lines. Meanwhile, the Stochastic Relative Strength Index (SRSI) indicator has delivered a downward crossover in the overbought region of the indicator.
Bitcoin Price Prediction: Where is the BTC Headed?
The signs emanating from the daily aren’t giving much hope to bullish traders at the moment. The last price candle here remains below most of the GMMA indicator lines. This indicates that bears have the potential advantage of causing further decline.
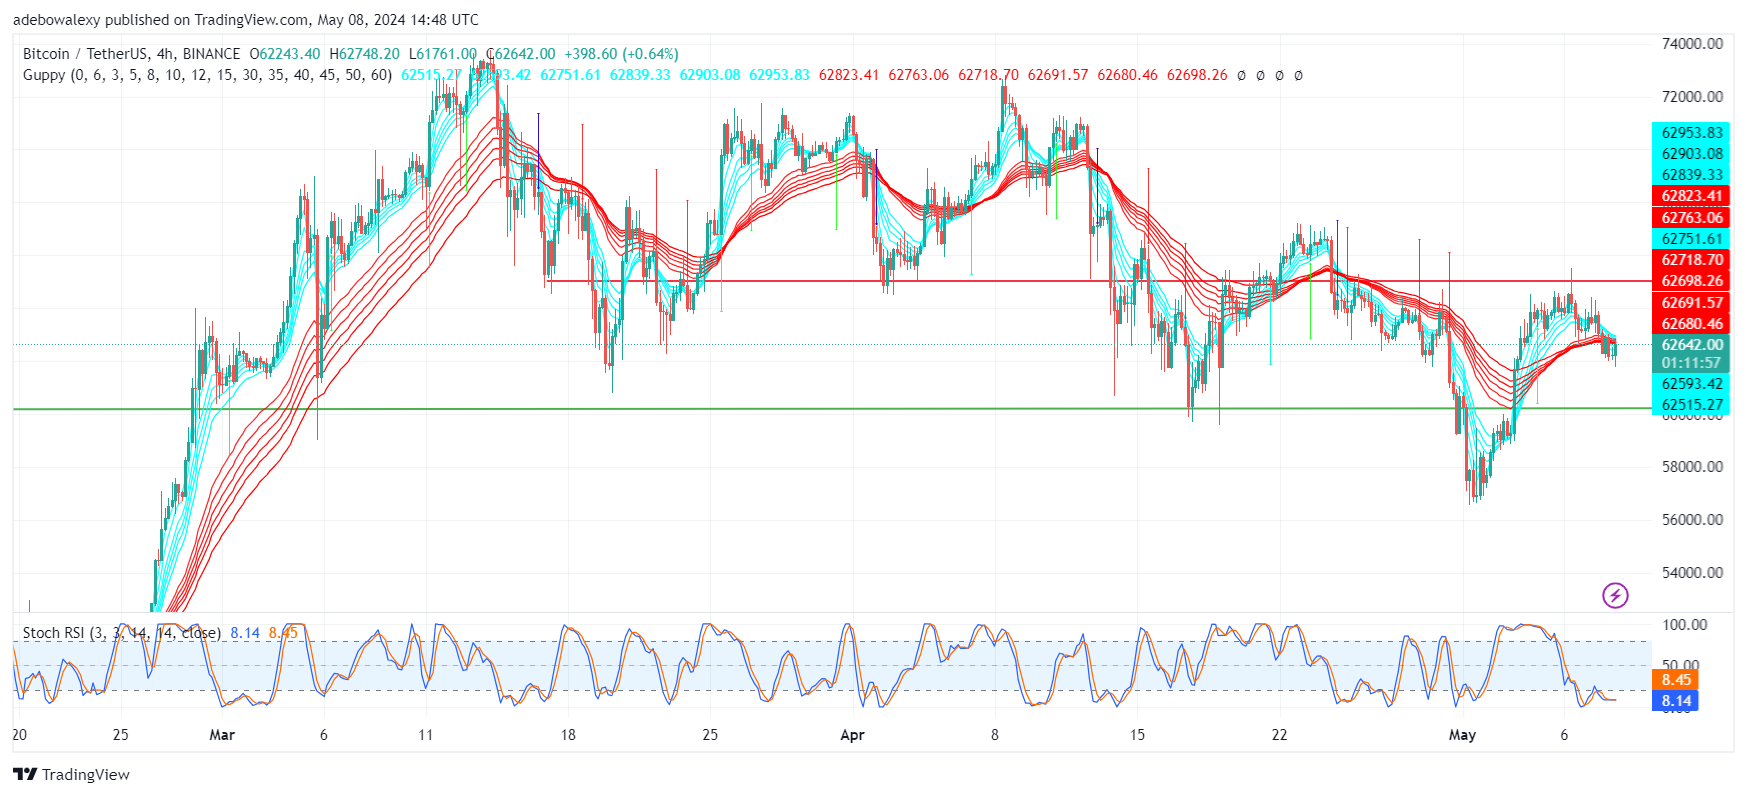
BTCUSDT – 4H Chart
More favorably for the bears, the SRSI indicator lines have delivered a downward crossover in the overbought region. Technically, this signals a potential increase in downward momentum in this market. Combining the signs coming from the two used technical indicators, it seems quite possible that the market may descend toward the $60,000 mark.
BTC/USDT Medium-term Trend: Bitcoin Remains Mostly Under Pressure (4H Chart)
Taking the price analysis further to a 4-hour BTC market, one can see that trading activity remains mostly below the GMMA lines. As such, this is causing more headwinds for the market. Meanwhile, the SRSI indicator lines are in the oversold region. Also, these indicator lines seem lifeless since there is no sign of a crossover; rather, the lines are trending sideways in the region.
The position of the last price candle isn’t favorable to hopes of an upside price increase. Most of the GMMA lines can be seen delivering a crossover above the current session, and that will only strengthen headwinds. Also, the lifelessness of the merged SRSI lines is indicative of the fact that the market lacks impetus at this point. Nevertheless, it seems more likely that the market may approach the $61,000 and $60,000 marks.