EigenLayer (EIGEN) Oscillates Near the $3.456 Critical Level
Estimated Reading Time: 3 minutes
Don’t invest unless you’re prepared to lose all the money you invest. This is a high-risk investment and you are unlikely to be protected if something goes wrong. Take 2 minutes to learn more

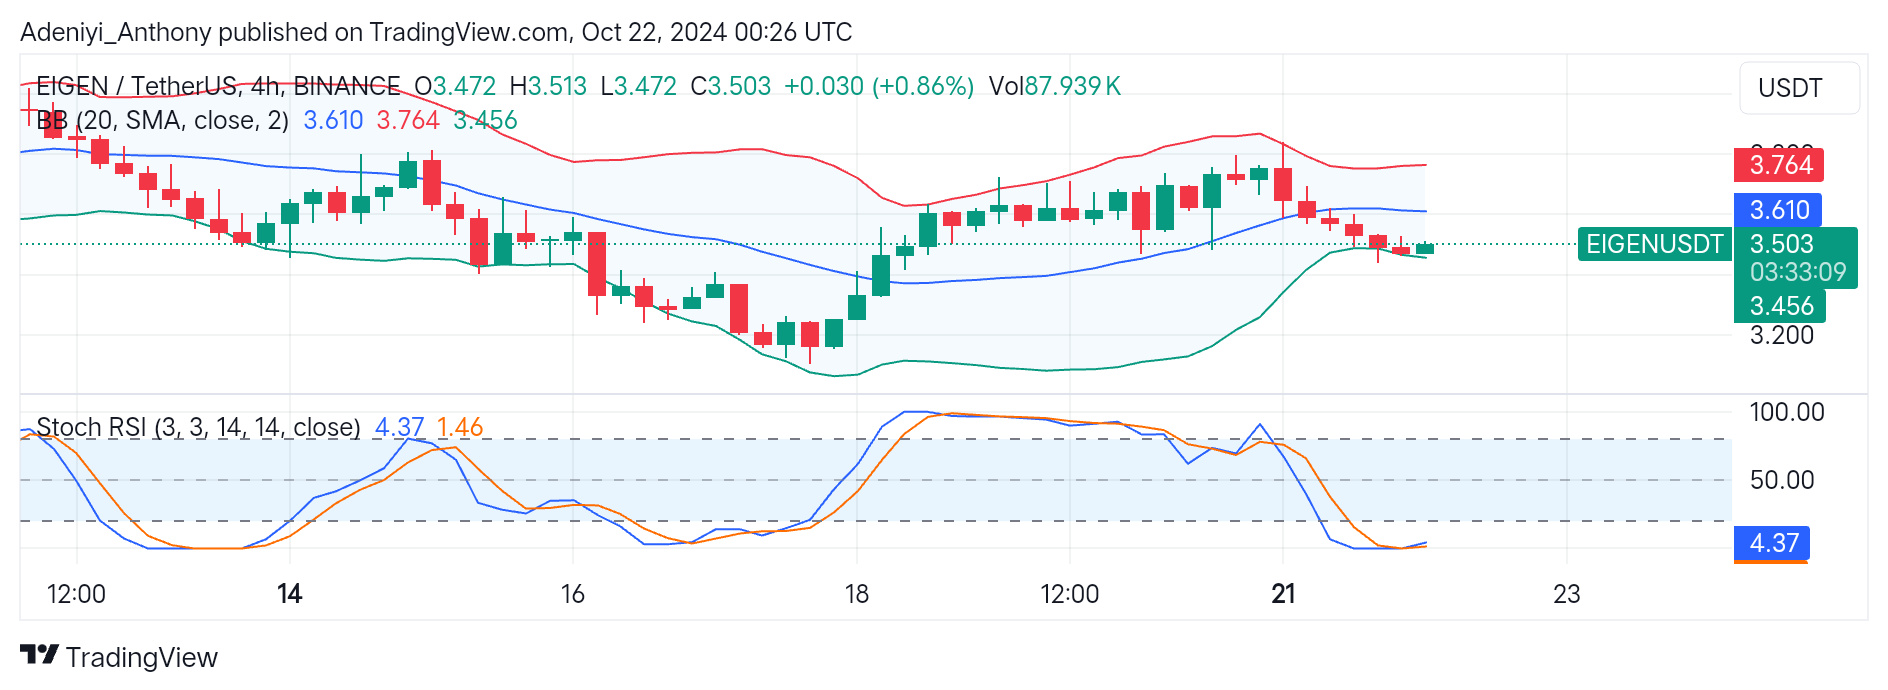
Analysis of the Eigenlayer (EIGEN) Against Tether (USDT) on the 4-hour timeframe shows that in recent times the pair has been on a downtrend towards the lower Bollinger band at $3.456. However, the indicators on the chart suggest the pair might see a trend reversal as the price currently oscillates near a support level.
EIGEN/USDT has seen strong selling pressure recently, but with the current uptick, the pair shows signs of potential upside reversal. However, the buying pressure is without strong conviction, as more trading volume is needed to confirm the uptrend.
At this point, a strong uptrend will be formed if the price breaks above the 20-period simple moving averages; otherwise, the price deepens more if it fails to hold above the lower band. Currently, the EIGEN/USDT trades at $3.506 with little positive difference from the recent downtrend.
Technical Indicators
Major Resistance Levels: $3.610, $3.764, and $3.900
Major Support Levels: $3.456, $3.200, and $3.000
EigenLayer Technical Analysis
EigenLayer against the Tether has responded to the selling pressure after a prolonged consolidation period between the upper region of the Bolliger bands. However, the pair oscillates around a critical level near the lower band. With the current situation, an increase in trading volume and a fall in price below the $3.456 level will result in the pair testing lower supports. Furthermore, a reversal to the upside is possible if the price finds solid support at the level to test the mid-band.
On the downside of the chart, the Stochastic Relative Strength Index (RSI) lines is flat and deep into the oversold region. This suggests the selling pressure is fading and reversal is around the corner. However, a clear crossover of the lines of the indicator will confirm the potential reversal.
EIGEN/USDT Slopes Downward, is Reversal Possible?
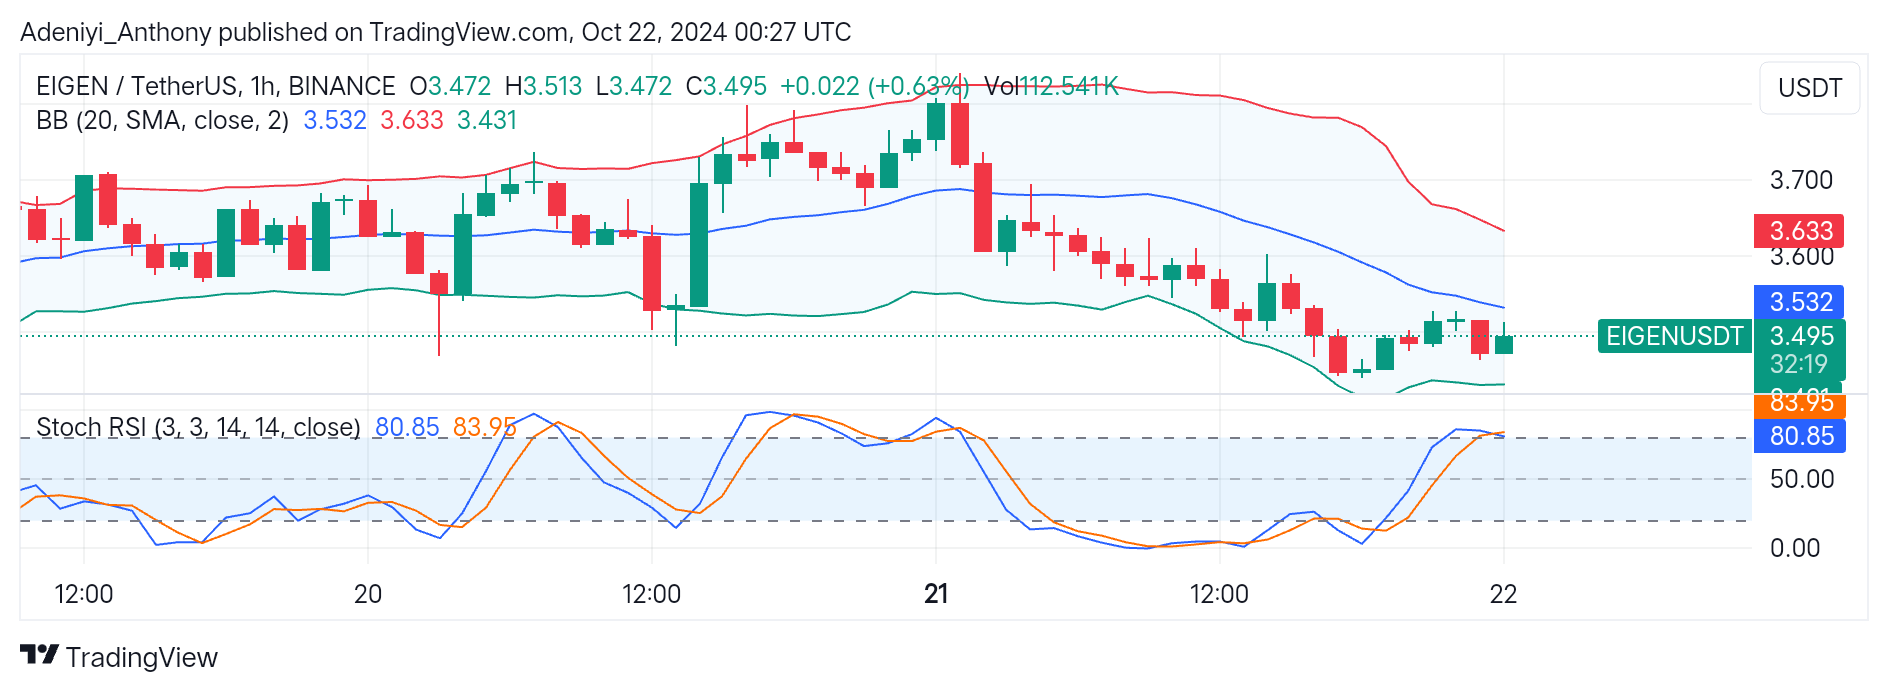
EIGEN/USDT has been in a downtrend for hours on the 1-hour timeframe. However, indicators in this timeframe suggest a further downtrend, as the lines of the Stochastic RSI lie in the overbought region with a slight crossover pointing downwards.
The recent price dip toward the lower band suggests a slight recovery or consolidation as the price tends toward the middle band. However, the Stochastic RSI overbought condition overrules this notion, as the $3.532 can be quite difficult to break with the waning buying pressure. The pair’s price in this timeframe is $3.495, slightly below the mid-band.
It is advisable to watch the price break the $3.532 before going long; otherwise, more selling pressure may push the price further south beyond the $3.431.
You can purchase crypto coins here. Buy LBlock