EigenLayer (EIGEN/USD) Aims for the $3.446 Level After a Failed Attempt at the $3.675 Level
Estimated Reading Time: 3 minutes
Don’t invest unless you’re prepared to lose all the money you invest. This is a high-risk investment and you are unlikely to be protected if something goes wrong. Take 2 minutes to learn more

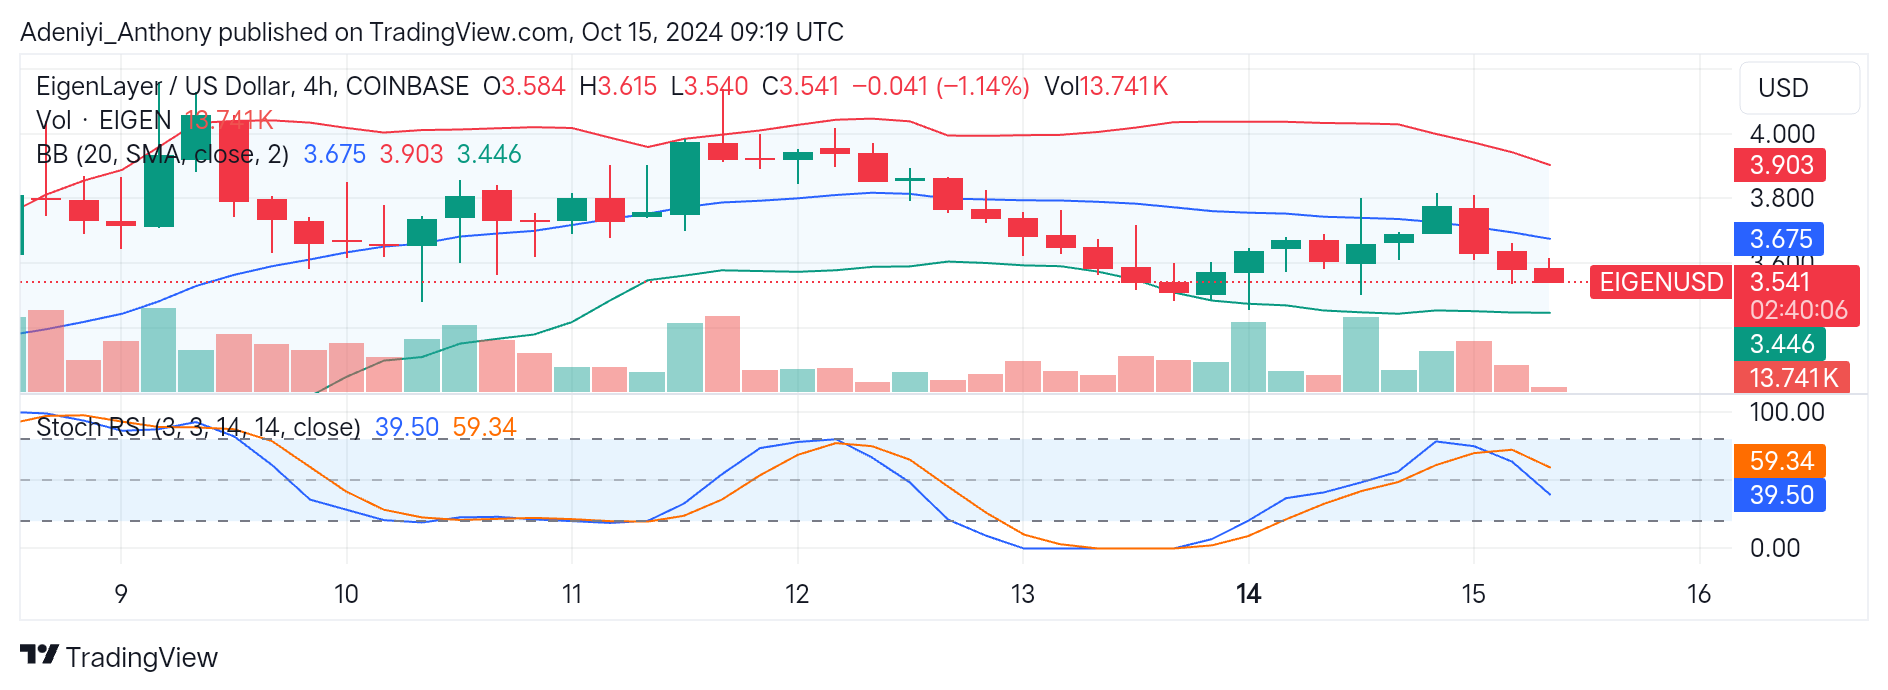
The overall market trend of the EigenLayer against the U.S. dollar on the 4-hour chart is currently without a clear direction. However, the formation of the bearish candlesticks after testing the dynamic resistance level of the middle Bollinger band suggests the presence of bearish traders in the market.
The recent price action of this market appears sideways in between the middle and lower bands, reflecting the occasional drop and spike in the trading volume. The distance between the bands appears to be squeezing, an indication of low market volatility, and a potential breakout from either side is on the horizon.
Presently, EIGEN/USD trades at $3.541, with 1.14% below the 20-period simple moving average at 3.675.
Technical Indicators
Major Resistance Levels: $3.675, $3.900, and $4.000
Major Support Levels: $3.446, $3.300, and $3.000
EigenLayer Technical Indicator Analysis
EigenLayer against the dollar is currently at a critical point. With the current price movement, the pair may bounce to the upside if the price finds strong support at the $3.446 dynamic level. However, a continued downtrend towards the $3.300 and $3.000 levels is possible if the price fails to hold at the lower band.
Additionally, the Stochastic RSI points to the overbought condition prevailing in the market despite the formation of bearish candlesticks. This reveals the probability that the price might break below the immediate support at the $3.446 support level.
EigenLayer Analysis: What to Expect?
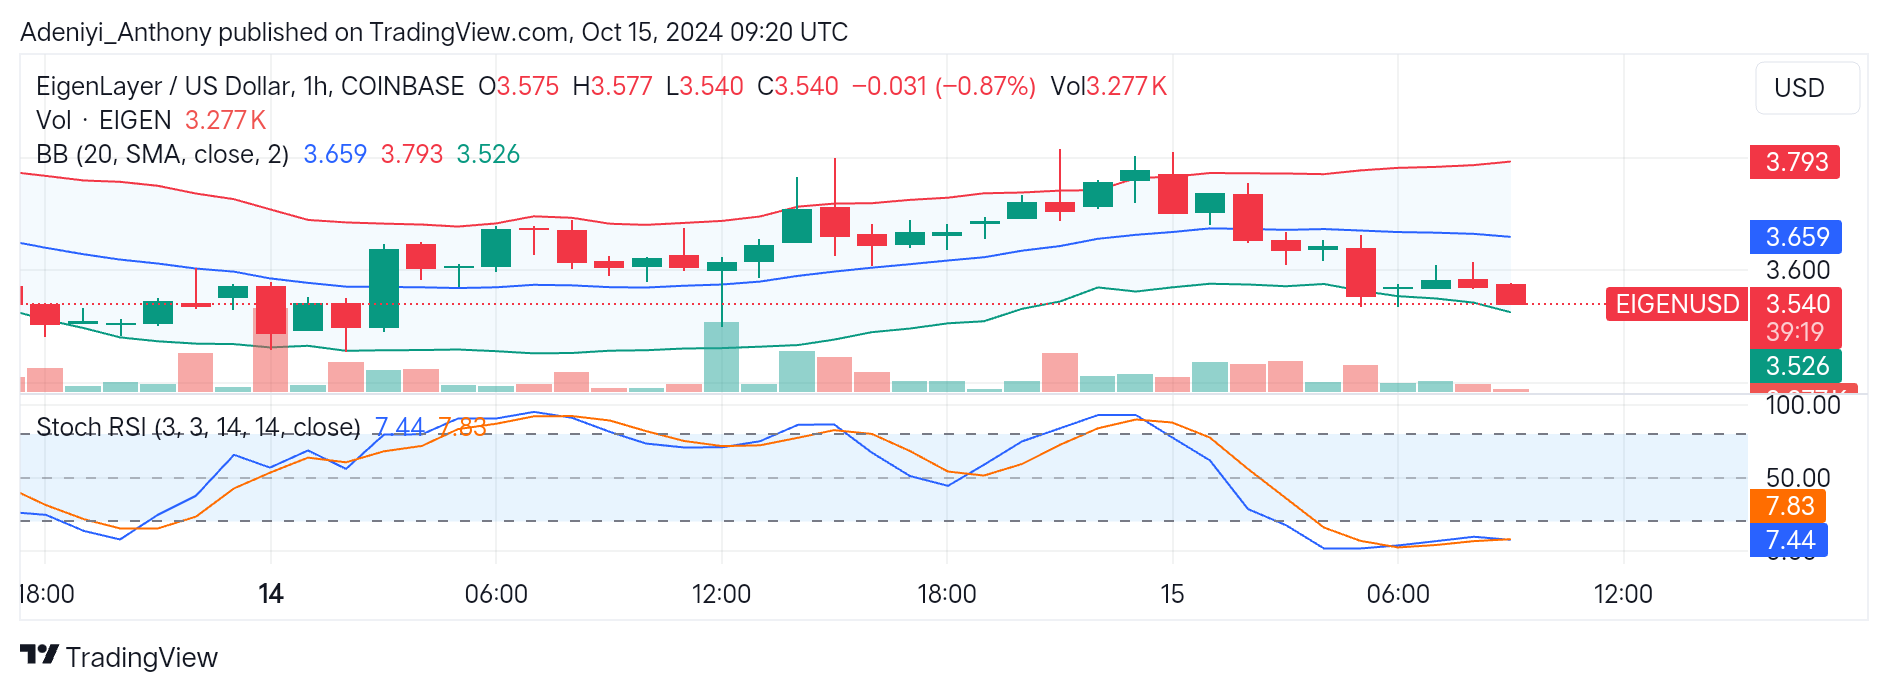
In the 1-hour timeframe, EIGEN/USD is seen oscillating around the $3.526 level. This reflects the great amount of selling pressure in the market. However, with the pair trading slightly above the lower band at $3.540. Traders should expect a short-term recovery due to the extended oversold condition for this period.
On the downside of the chart, the Stochastic oscillator also suggests the pair is operating deep into the oversold region. This reflects the absence of bullish traders in the market.
However, with prolonged oversold condition suggestions from both indicators in this timeframe, a reversal to the upside will be possible with an increased volume and strong bullish momentum. If not, the pair may experience a downtrend or continuation of the range-bound movement.
You can purchase crypto coins here. Buy LBlock