EigenLayer (EIGEN/USD) Hits the $3.70 Level With Indecisive Traders
Estimated Reading Time: 3 minutes
Don’t invest unless you’re prepared to lose all the money you invest. This is a high-risk investment and you are unlikely to be protected if something goes wrong. Take 2 minutes to learn more

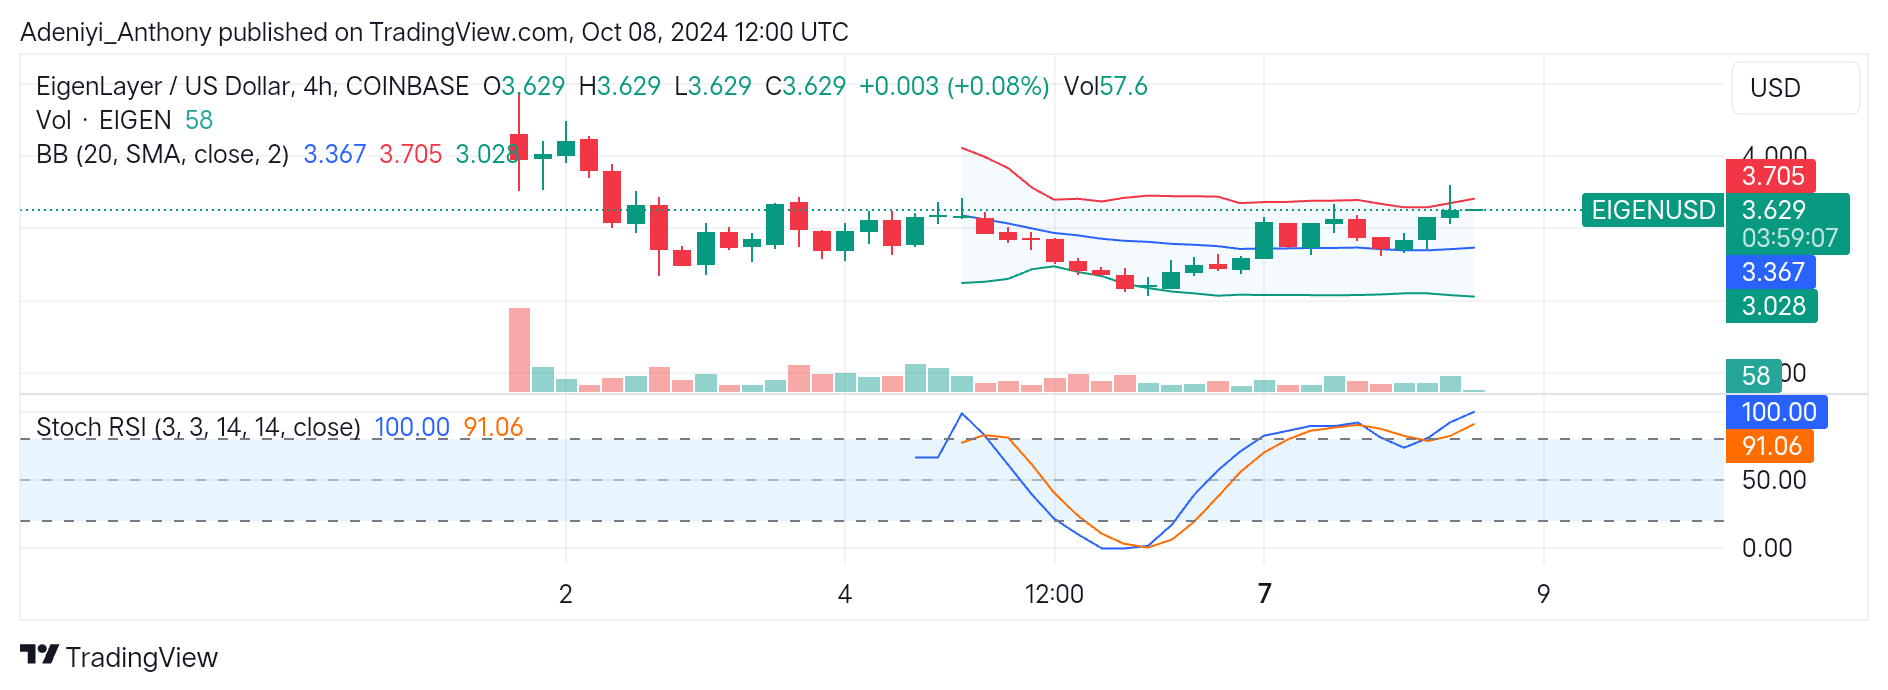
The broader market sentiment surrounding the Eigen/USD on a 4-hour chart appears without clear direction. Currently, the market is ranging between the middle and upper Bollinger bands. The pair heads towards the $3.705 level despite low trading volume. This suggests that the traders await factors that could spark a stronger movement.
On a general scale, the crypto market has experienced a lot of volatility in previous months, which is mostly driven by macroeconomic factors. However, if the factors continue to improve, it will be a determinant for EigenLayer’s direction.
Recently, the price of the pair has been moving sideways with neither the bull nor the bear dominating. This can be noticed in the alternation of the red and green candlesticks. However, the price has been relatively stable, swinging between the $3.36 and the $3.7 level. This suggests low volatility in the market. Currently, EigenLayer against the United States Dollar trades at $3.629.
Technical Indicators
Major Resistance Levels: $3.70, $4.00, and $4.30
Major Support Levels: $3.36, $3.02, and $2.75
EigenLayer Technical Indicator Analysis
The recent price movement of the EigenLayer against the Dollar on the chart above reveals that the pair is in a tight consolidation phase between the middle and upper Bollinger bands. Traders in this market seem to be watching the market closely. However, an increase in the trading volume could provide a clear direction for Eigen/USD, which would determine a potential breakout above the $3.70 level or a breakdown beyond the $3.36 level.
On the other hand, the Stochastic Relative Strength Index is operating in the overbought region. This indicates a potential short-term correction is on the horizon or the continuation of the consolidation phase. However, if the price can break above $3.7, $4.00 is possible.
EigenLayer: Towards the North or South?
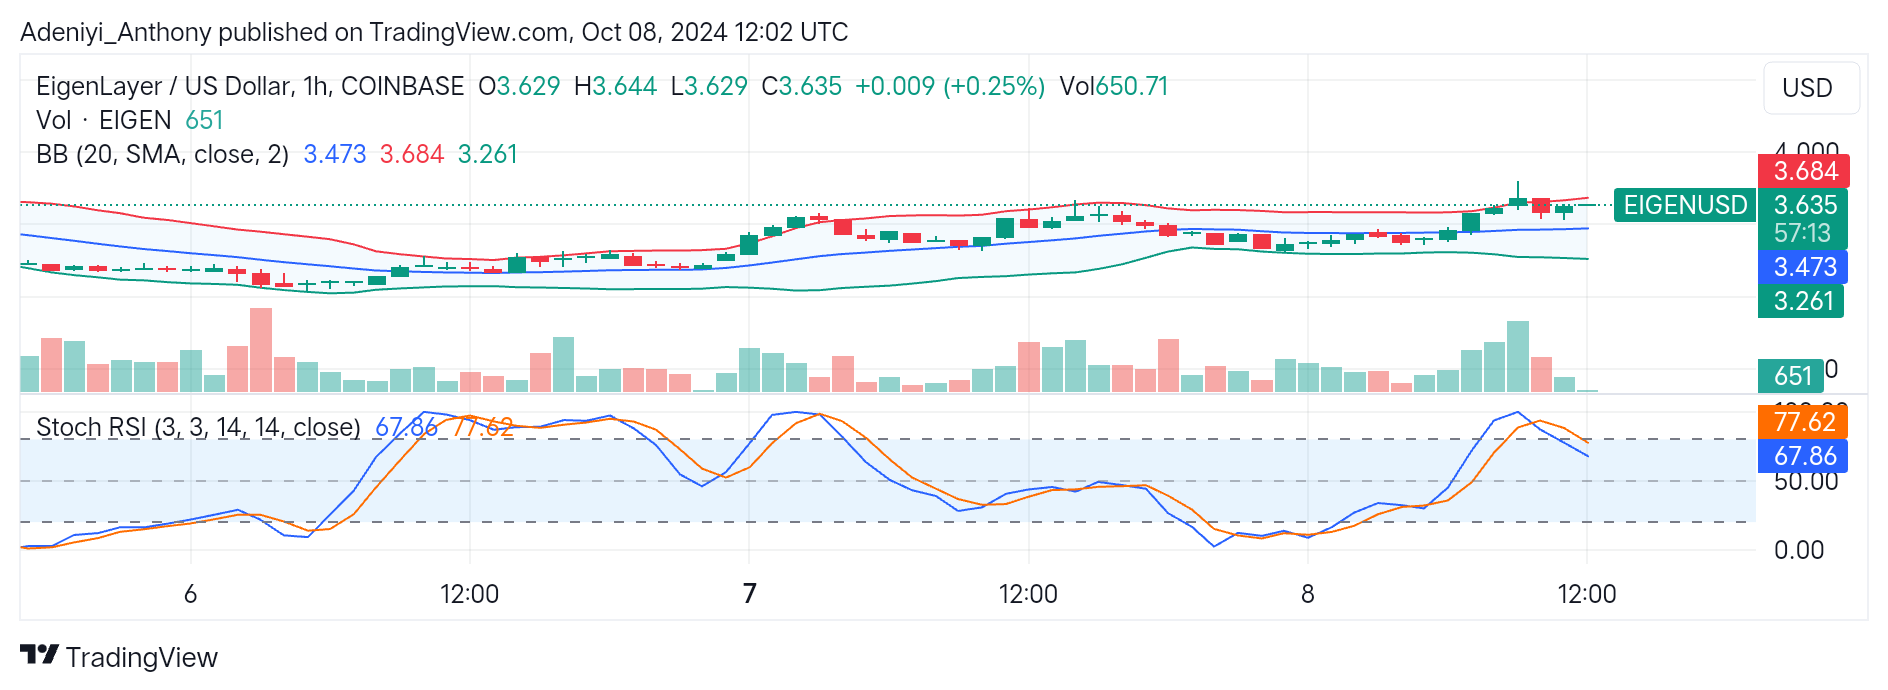
EigenLayer on the 1-hour chart is trading at $3.635 and slightly above the close of the previous session. The pair in this timeframe has experienced a huge volume increase, which could translate to the beginning of a significant price movement. However, the activities of the price towards the upper Bollinger band at the $3.684 level signal an overbought condition. This could mean either pulling back from or piecing through the level.
On the downside of the chart, the Stochastic RSI is operating in the neutral zone, signaling neither an overbought nor an oversold condition. This suggests an upside trajectory is possible before the indicators signal otherwise.
In conclusion, if the price fails to break the upper band at $3.684, expect a pullback or a short-term consolidation.
You can purchase crypto coins here. Buy LBlock