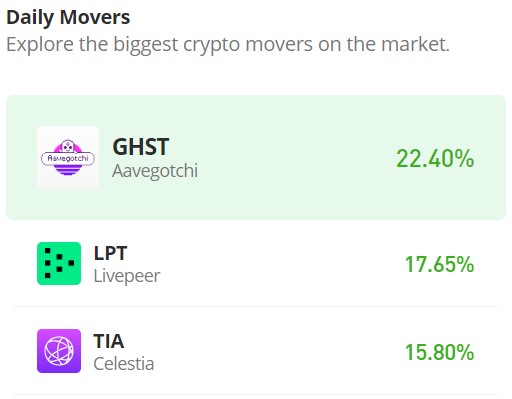
Celestia (TIA/USD): A Bullish Breakout Faces Resistance at the $6.00 Price Level
Estimated Reading Time: 3 minutes
Don’t invest unless you’re prepared to lose all the money you invest. This is a high-risk investment and you are unlikely to be protected if something goes wrong. Take 2 minutes to learn more
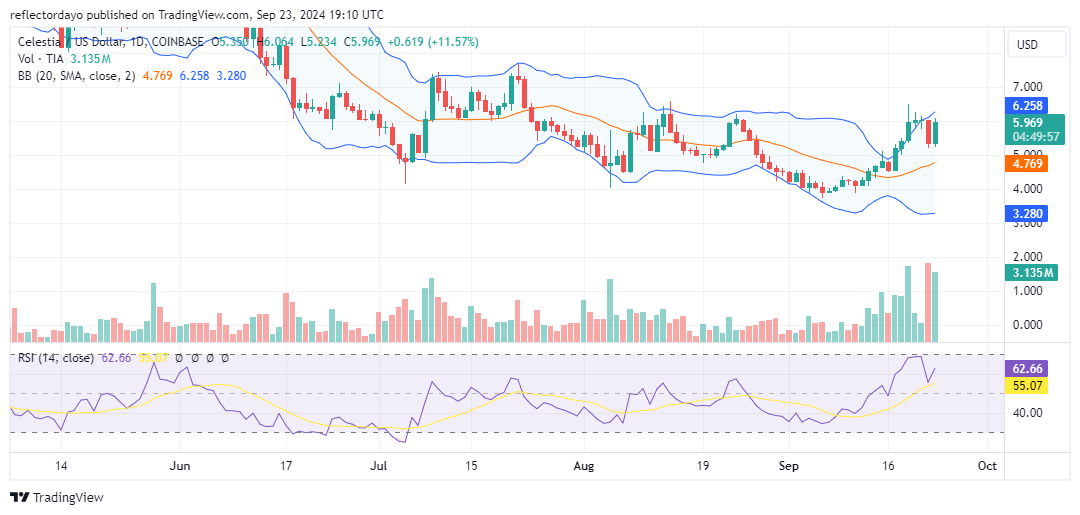
On September 16, the Celestia market reached a significant milestone as bullish momentum surged, enabling it to break through the long-standing $6.00 resistance level. However, this upward momentum could not be maintained, and after two days of stagnation between demand and supply, the market reversed and established a new support level at $5.30. From this point, the market rebounded to reapproach the critical $6.00 price level.
Celestia Market Data
- TIA/USD Price Now: $6.00
- TIA/USD Market Cap: $ 1.3 billion
- TIA/USD Circulating Supply: 212 million
- TIA/USD Total Supply: 1.1 million
- TIA/USD CoinMarketCap Ranking: #58
Key Levels
- Resistance: $6.50, $7.00, and $7.50
- Support: $4.50, $4.00, and $3.50.
Celestia Market Through the Lens of Indicators
After the market price corrected from the $6.00 threshold and established a higher support level, today’s trading activity is represented by a notably bullish candlestick. This crypto signal reflects significant and aggressive buying activity that has propelled the market back toward the $6.00 price level. It’s important to note that the market remains volatile, as indicated by the Bollinger Bands, suggesting that bulls may be taking advantage of this volatility. However, this situation poses risks; bears at the $6.00 mark could also capitalize on the fluctuations.
Considering the volume of trade indicator, bulls appear to have a favorable chance of breaking through this resistance level once again. Today’s volume histogram indicates a strong bullish bias, reinforcing the potential for upward movement.
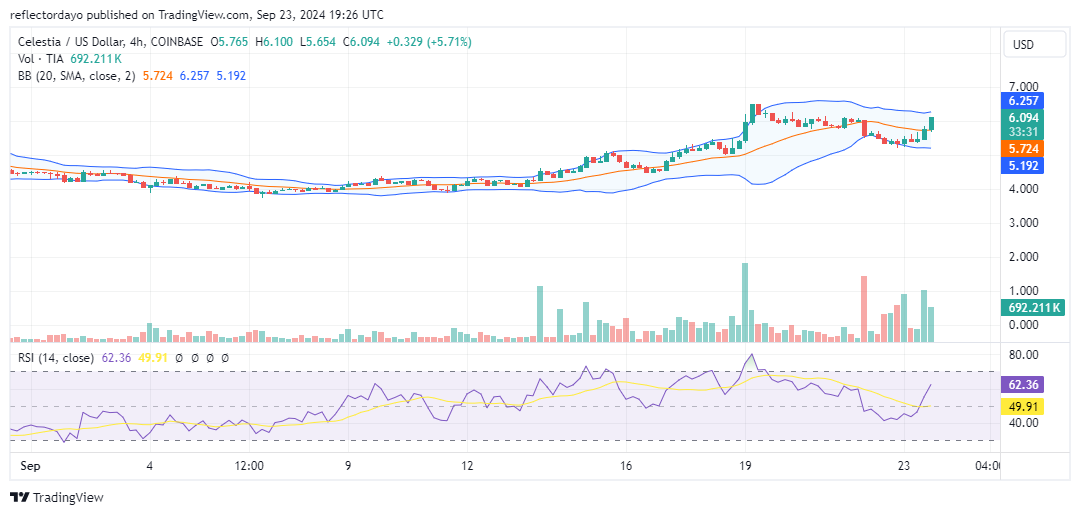
TIA/USD Price Prediction: 4-Hour Chart Analysis
From the 4-hour chart perspective, the market is currently in a consolidation phase, with prices moving sideways as bullish and bearish forces clash at this level. However, the bearish position appears to be under pressure and may soon yield to an upward trend in the bull market.
If Celestia can successfully maintain support above $6.00 and break through the $6.50 resistance, it could indicate a more sustained uptrend. Investors should closely monitor technical indicators and market sentiment for insights into potential price direction.