Solana Price Prediction: SOL/USDT Bears Pressing Further
Estimated Reading Time: 3 minutes
Don’t invest unless you’re prepared to lose all the money you invest. This is a high-risk investment and you are unlikely to be protected if something goes wrong. Take 2 minutes to learn more
SOL Price Prediction (February 27)
The general cryptocurrency market is facing strong headwinds, which have also affected the Solana market, causing the token’s price to continue declining. Moreover, further downward movements are likely, so let’s take a closer look at the market below.
SOL/USDT Long-Term Trend: Bearish (Daily Chart)
Key Price Levels:
Resistance: $140.00, $150.00, $160.00
Support: $130.00, $120.00, $110.00
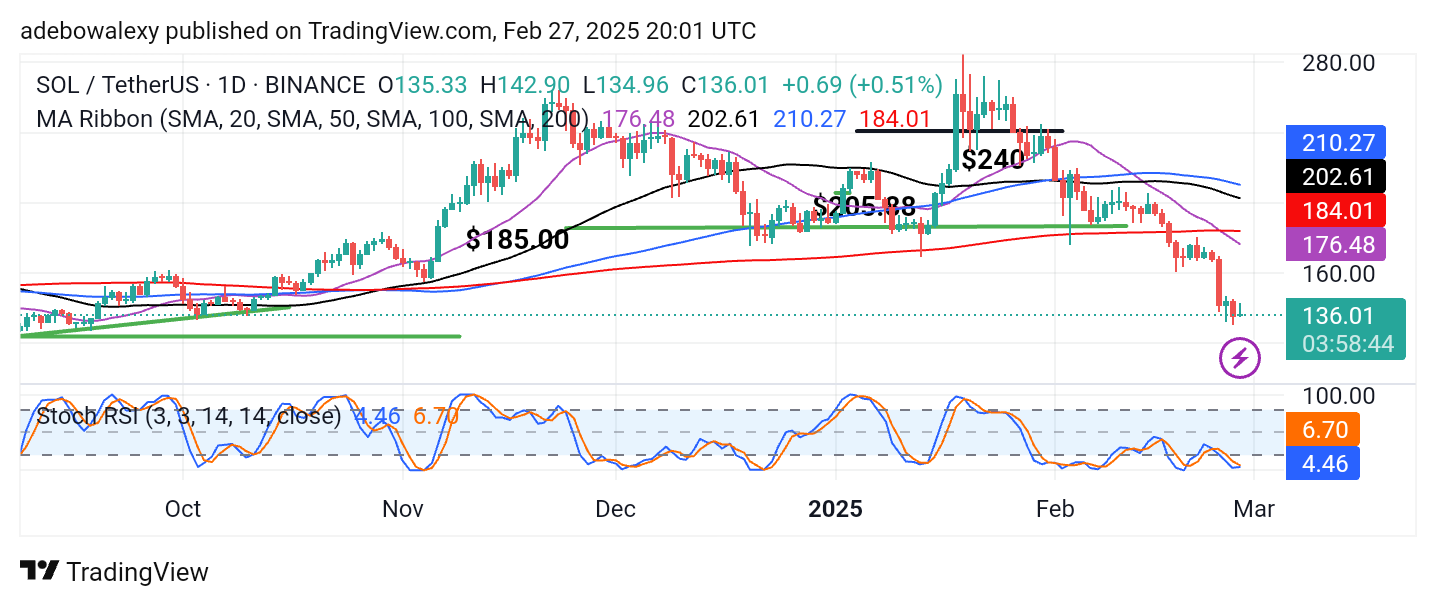
Recent price activity shows SOL trading below all the Moving Average (MA) lines. Additionally, the 20-day and 200-day MA curves recently crossed above the price action, reinforcing the bearish trend. As a result, the market has continued its descent to lower price levels.
The latest price candle retains a green appearance but is heavily compressed, revealing a long upper shadow. At the same time, the Stochastic Relative Strength Index (Stochastic RSI) lines are converging in the oversold region, which may signal a potential shift.
Solana Price Prediction: SOL/USDT Downward Retracement May Be Nearing an End
Indeed, price action in recent days has seen a significant decline. Due to this, the market has dropped below a four-month-old price mark of $160.00. However, the ongoing price action suggests that buyers may be attempting to stage a reentry, as indicated by the formation of the latest price candle on the chart.
The emergence of a green, hammer-shaped price candle at the end of a downtrend suggests that downward forces may be losing momentum. Nevertheless, considering that the price action remains below all the MA lines, Solana’s price is still under significant selling pressure.
However, the positioning of the RSI indicators also hints at a potential upward rebound in the market.
Solana Price Prediction: SOL/USDT Remains Open to Downward Retracement (4-Hour Chart)
On the 4-hour chart, the Solana market maintains a clear bearish trend. Most recently, all price candles have been red, reflecting continued selling pressure. However, the price is still holding above the $136.00 threshold level.
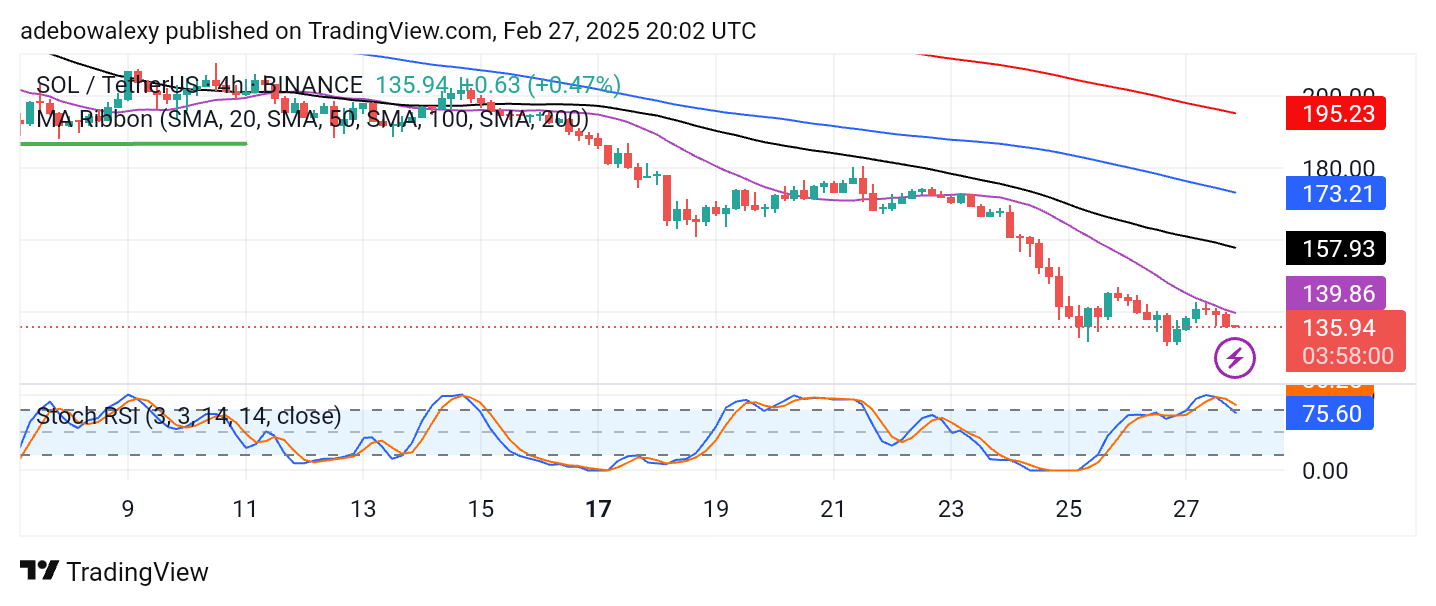
The latest price candle appears red but with a small body, indicating that buyers and sellers are actively battling for control. Additionally, the Stochastic RSI lines have continued to fall and, as of writing, are making their way through the 80 levels of the indicator, signaling a potential shift.
While the daily and 4-hour charts offer slightly different perspectives on the market’s direction, one thing remains clear: price action is still below all the MA lines. As such, the market remains in a downtrend, and further declines toward the $130.00 price level appear likely.