Polkadot (DOT) In a Downward Move , Revisits $40 Low, Uptrend Likely
Estimated Reading Time: 2 minutes
Don’t invest unless you’re prepared to lose all the money you invest. This is a high-risk investment and you are unlikely to be protected if something goes wrong. Take 2 minutes to learn more
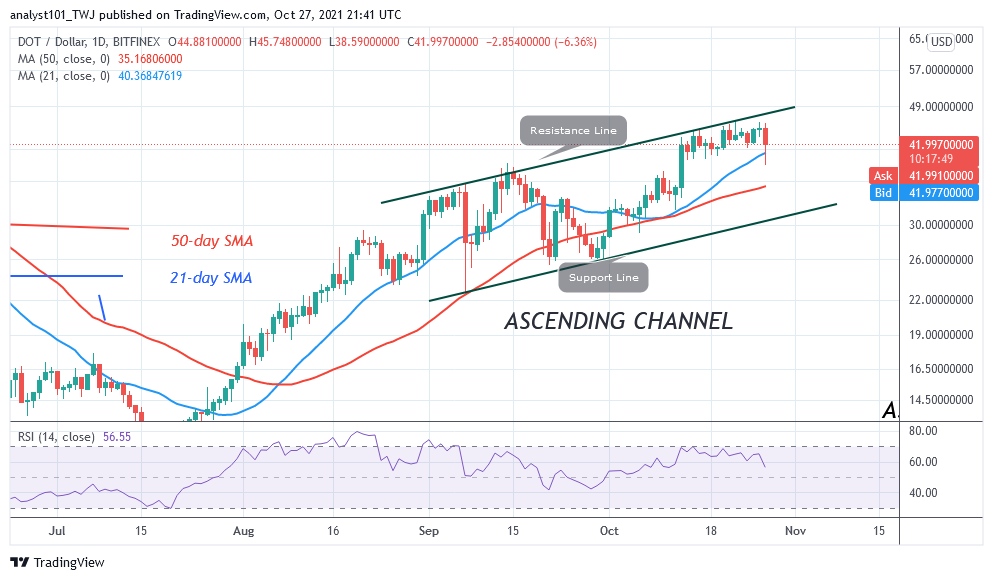

Polkadot (DOT) Long-Term Analysis: Bullish
Polkadot’s (DOT) price is trading above the moving averages after the recent breakdown. The current uptrend was stalled at the high of $46 after the bulls fail to sustain DOT price above the recent high. Today, the cryptocurrency faces rejection at $46 as the altcoin drops sharply. The altcoin has fallen to the low of $38.59 and the Polkadot risks a further downward move.
Polkadot (DOT) Indicator Analysis
The cryptocurrency has fallen to level 55 of the Relative Strength Index period 14. Polkadot is in the uptrend zone and capable of a further upward move. DOT price has fallen to the support above the 21-day moving averages. The crypto will resume an upward move if the 21-day SMA support holds.DOT price is below the 40% range of the daily stochastic. The market is in a bearish momentum.
Technical indicators:
Major Resistance Levels – $48, $52, $56
Major Support Levels – $32, $28, $24
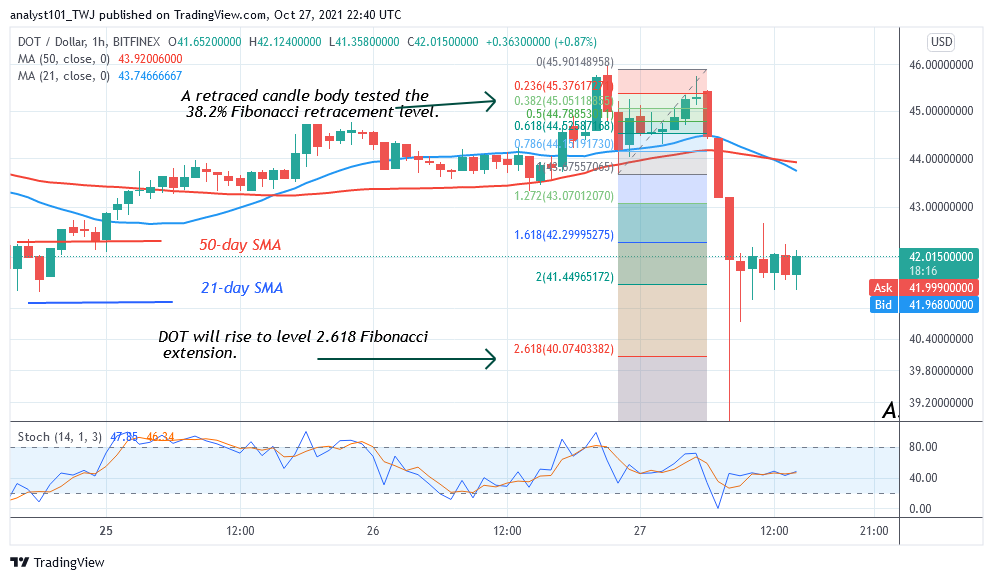
What Is the Next Direction for Polkadot (DOT)?
On the 4 –hour chart, Polkadot is in a downward move. The altcoin has broken below the moving averages as price reaches the low of $40. Meanwhile, on the October 26 uptrend, a retraced candle body tested the 38.2% Fibonacci retracement level. The retracement indicates that DOT will fall to level 2.618 Fibonacci extension or $40.28.
You can purchase crypto coins here. Buy Tokens
Note: Cryptosignals.org is not a financial advisor. Do your research before investing your funds in any financial asset or presented product or event. We are not responsible for your investing results