Polkadot (DOT) Battles the Resistance at $33, Uptrend Likely
Estimated Reading Time: 2 minutes
Don’t invest unless you’re prepared to lose all the money you invest. This is a high-risk investment and you are unlikely to be protected if something goes wrong. Take 2 minutes to learn more

Polkadot (DOT) Long-Term Analysis: Bullish
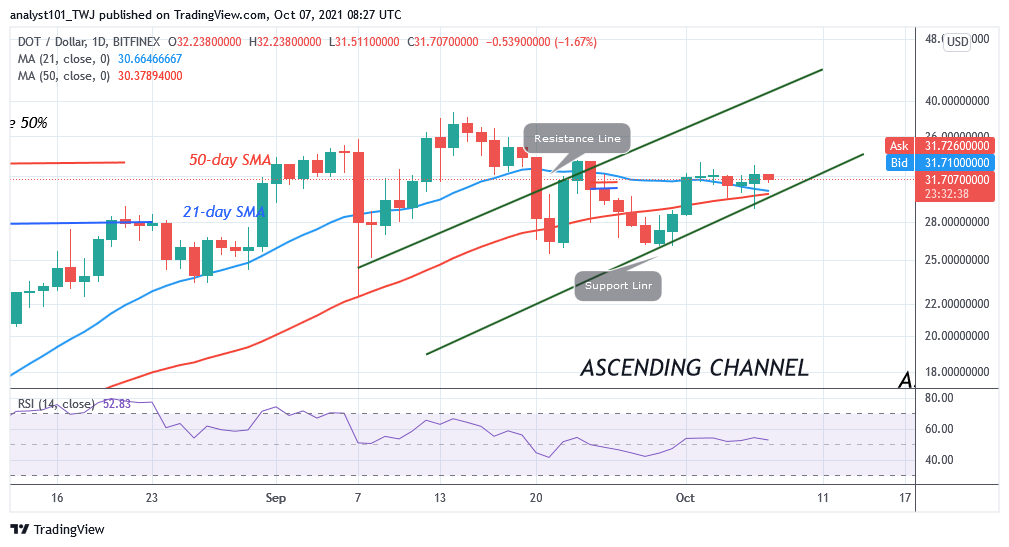
Since September 29, Polkadot’s (DOT) price has been in an upward move. The bulls broke above the moving averages but could not sustain the bullish momentum above the $33 high. In the first uptrend of October 2, the bulls were resisted. DOT/USD declined to $29.20 low. Today, the altcoin was repelled as it retraced to the support above the 21-day SMA. The crypto’s price is above the moving averages and there is a tendency for a further upward movement of the coin. Polkadot will rally to $35 if the bulls break the resistance at $33.
Technical indicators:
Major Resistance Levels – $48, $52, $56
Major Support Levels – $32, $28, $24
Polkadot (DOT) Indicator Analysis
The crypto’s price is above the moving averages suggesting a further upward movement of the coin. Polkadot is at level 52 of the Relative Strength Index period 14. The altcoin is in the uptrend zone and capable of rising on the upside. The crypto is below 80% area of the daily stochastic. The crypto has already declined and found support above $31.
What Is the Next Direction for Polkadot (DOT)?
Polkadot has found support above $31. There is a likelihood of further upward movement of the coin. Meanwhile, on the October 6 uptrend, a retraced candle body tested the 61.8% Fibonacci retracement level. The retracement indicates that DOT will rise to level 1.618 Fibonacci extension or $34.73.
You can purchase crypto coins here. Buy Tokens
Note: Cryptosignals.org is not a financial advisor. Do your research before investing your funds in any financial asset or presented product or event. We are not responsible for your investing results