Cardano Sinks to a Five-Year Low — Is More Pain Ahead for ADA?
Estimated Reading Time: 3 minutes
Don’t invest unless you’re prepared to lose all the money you invest. This is a high-risk investment and you are unlikely to be protected if something goes wrong. Take 2 minutes to learn more

Cardano is testing territory it has not visited in half a decade. ADA/USD has pushed to a daily low of $0.2071 — a level that, when placed against the cycle high of $0.6187, represents a drawdown of over 66% from the period’s peak. In a week where Bitcoin itself fell nearly 11%, ADA has not merely followed the market lower — it has underperformed it, and the charts suggest the structural case for a floor is still being built rather than confirmed.
ADAUSD Daily Chart Outlook
The TradingView daily charts captured at 14:55 UTC on June 3, 2026 show an asset that remains technically compromised on the USD pair while flashing the first tentative recovery signal on its Bitcoin cross. On ADA/USD (Coinbase), price closed at $0.2138 with the Parabolic SAR still above at $0.2374 — confirming the daily downtrend is intact.
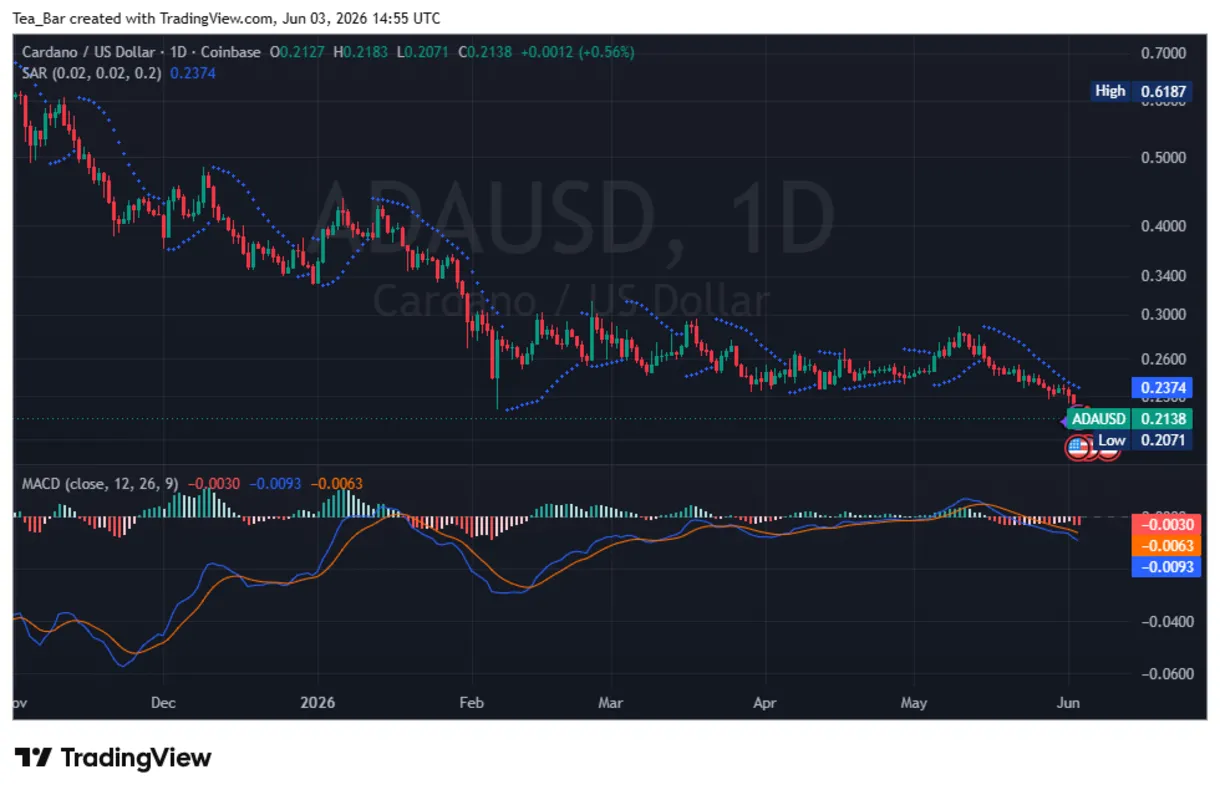
The MACD histogram reads −0.0063 against a signal line of −0.0093, with the MACD at −0.0030. The histogram is compressing and beginning to turn, which indicates slowing downside momentum — but the lines have not crossed, and until they do, the path of least resistance remains lower. The $0.2071 daily low is the number to watch; a weekly close below it would open a technical void with minimal historical support until the $0.15–$0.17 range.
ADABTC Chart Outlook
The ADA/BTC daily chart (Binance) offers a marginally more constructive reading. At ₿0.00000321, price is trading just above the SAR at ₿0.00000313 — the narrowest SAR gap on this pair since the March lows.
The MACD on this pair has compressed almost exactly to zero, with the histogram and signal lines converging in a configuration that typically precedes a directional decision within days rather than weeks.
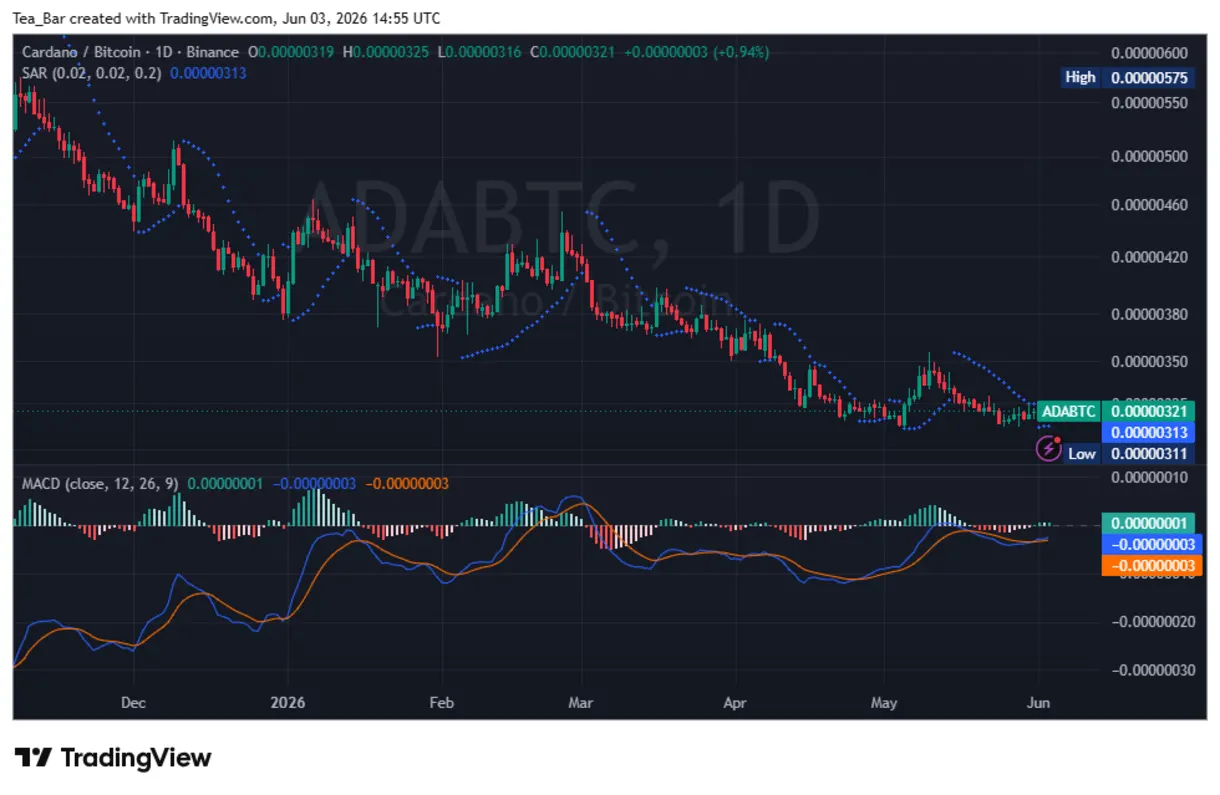
A daily close above ₿0.00000325 with the SAR flipping below price would be the first credible BTC-relative buy signal ADA has generated since April.
Conclusion
The USD chart says distribution is still in progress. The BTC chart says a momentum decision is imminent. Until those two resolve in the same direction, ADA at $0.21 is a chart to monitor closely — not one to chase.