Cardano (ADA/USDT) Stalls Below Key Moving Averages as Bears Defend the $0.40 Zone
Estimated Reading Time: 3 minutes
Don’t invest unless you’re prepared to lose all the money you invest. This is a high-risk investment and you are unlikely to be protected if something goes wrong. Take 2 minutes to learn more
The market for Cardano against Tether has declined by 3.31% in the last 24 hours. The pair has dropped even below the 1.13% crypto fall. Many analysts believe the wider crypto downturn and rising Bitcoin dominance are major causes of this fall.
Speculations about capital rotation away from Cardano seem to be gaining momentum. This affects the pair’s ability to break out above $0.420. The resistance line seems impossible to break.
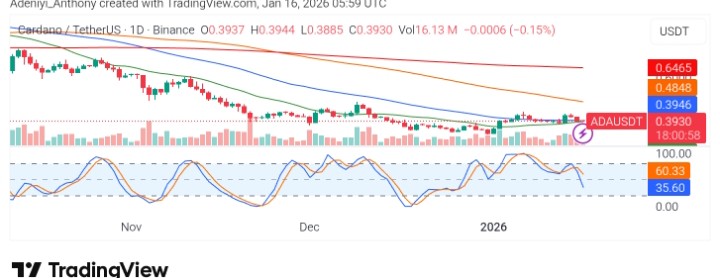
Currently, Cardano trades at $0.3930, recording over 16 million traded volumes on the daily chart.
Technical Indicators
Major Resistance Levels: $0.400, $0.425, and $0.480
Major Support Levels: $0.388, $0.365, and $0.350
Technical Analysis
On the daily timeframe, Cardano against Tether remains locked in a broader downtrend. The pair appears to be trading below the cluster of a downward-trending simple moving average indicator. As it stands, the price action around $0.3930 shows prolonged compression, signaling indecision rather than strength. Meanwhile, the inability of the pair to reclaim the 50, 100, and 200 SMA confirms that bullish momentum is structurally weak as volume remains relatively weak.
From another angle, the momentum indicator beneath the chart reflects neutrality leaning bearish, with oscillators failing to sustain bullish expansion.
To this end, the daily structure favors consolidation with downside risk unless Cardano can decisively reclaim the $0.42 region on strong volume.
Cardano Update
Recently, Cardano has been on a move to establish an upside move after an initial significant move in the previous sessions. The market appears to be moving correctly to the south, potentially setting the stage for an upside action. As it stands, the $0.390 and $0.370 support is still alive, suggesting the possibility of a move towards a $0.41 breakout.
To this end, if momentum to the downside improves with a break to the downside, another low may be seen.
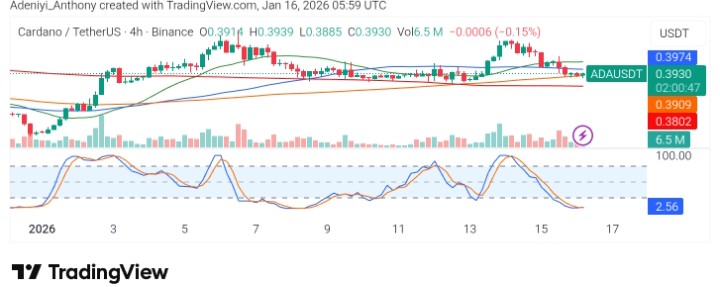
ADA/USDT Analysis: Slipping Back into Support Range; What’s Next?
On the 4-hour time frame, ADA/USDT has been reported to have recently attempted a breakout above a local high but was quickly rejected. The price appears to have returned toward the rising orange moving average near $0.39. This area now acts as a pivotal short-term support.
Meanwhile, the stochastic oscillator has rolled over into oversold territory, indicating short-term selling pressure but also hinting at a possible relief bounce. However, any bounce at this level may seem corrective except if a break above $0.400 can be maintained. To this end, ADA may oscillate at this level before recording a leg up.
You can purchase crypto coins here. Buy Crypto