Litecoin (LTC/USD) Price Is Swinging Up, Sequence to a Correction
Estimated Reading Time: 3 minutes
Don’t invest unless you’re prepared to lose all the money you invest. This is a high-risk investment and you are unlikely to be protected if something goes wrong. Take 2 minutes to learn more
Litecoin Price Prediction – March 26
On the 20th day’s session of transactions between Litecoin and the US fiat money, a bullish candlestick formed, sequence to a correction, as the price is currently swinging up to trade around $88.87 value line.
The base of the force that gave rise to the current rallying motion is located at a level point approximately at $80, which is in proximity to the lower Bollinger Band. That observation suggests that pushers in long positions should exercise caution by protecting their positions from any abrupt, violent reversal that could result in a revisitation of the trade zone.
LTC/USD Market
Key Levels:
Resistance levels: $100, $110, $120
Support levels:$75, $70, $65
LTC/USD – Daily Chart
The LTC/USD daily chart showcases that the crypto-economic price is swinging up, sequence to a correction.
In an attempt to gain momentum following the 20th positive candlestick to emerge from the lower Bollinger Band, a string of smaller bullish candlesticks has been forming.The Bollinger Band trend lines have provided a crypto signal, leaving the resistance of $100 as the main next focus to be touched or breached.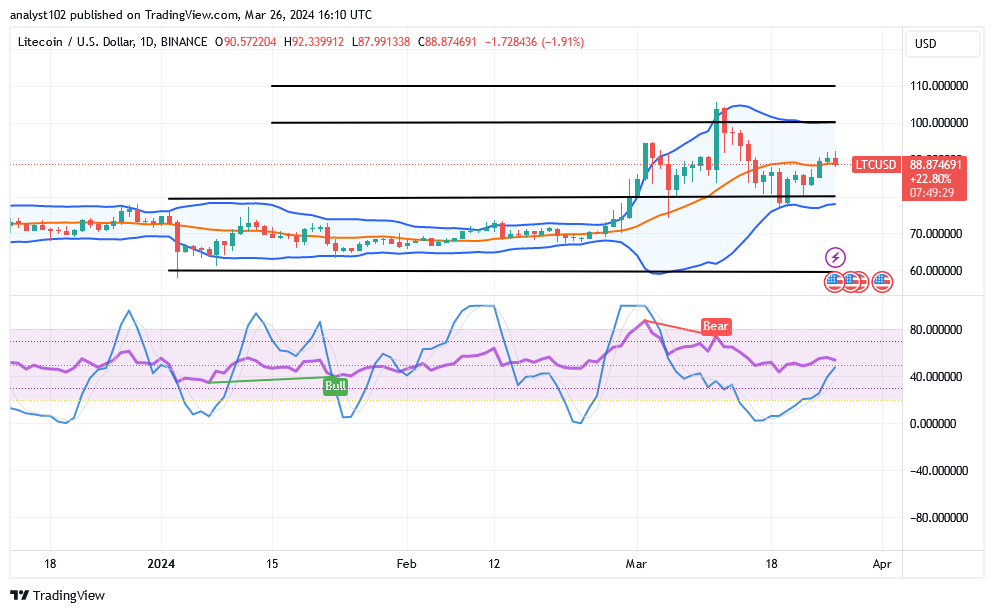
Does the market for litecoin/dollar still have enough strength to move higher from its current trading value without much difficulty?
There is still an element of leveraging on the crypto signal provided from the lower end of the Bollinger Band for bulls to thrive, given that the LTC/USD market has been seen swinging up, sequence to a correction.
As the price has gotten a formidable rebound from the lower Bollinger Band indicator, buyers ought to have play alongside its second formed candlestick. As the price is showing a slight pullback, it denotes that longing activities might have to be cautiously suspended for a while.
Sellers may start to tighten their margin in anticipation of receiving a shorting entry order from the middle Bollinger Band trend line if they sense a decrease in price action. The majority of selling entry, however, risk being invalidated if a push is not formed or derived at any point in time. This is because a favorable outcome might see the market extend its valuation back to the $100 line.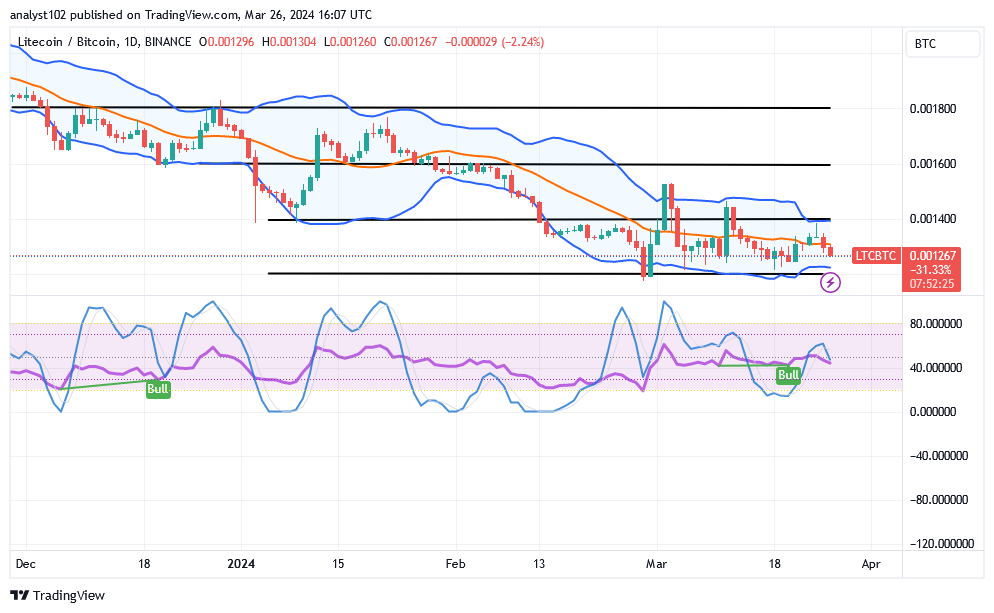
LTC/BTC Price Analysis
In contrast, the Litecoin trade may attempt to swing up against the trending stance of Bitcoin, leading to a correction that the base economy has embarked upon over a couple of sessions.
To establish a baseline against which the former cryptocurrency can reclaim its catalysts to bounce back to the upside against its latter trading counterpart, the Bollinger Band trend lines have remained flat at the bottom end. The stochastic oscillators tend to cross back south around 40. Furthermore, an indication suggests that there may be a short-lived propensity for the forces to be to the downside.
Note: Cryptosignals.org is not a financial advisor. Do your research before investing your funds in any financial asset or presented product or event. We are not responsible for your investing results
You can purchase Lucky Block here. Buy LBLOCK