Litecoin (LTC/USD) Trade Reverses at $100, Aiming for Recoups
Estimated Reading Time: 3 minutes
Don’t invest unless you’re prepared to lose all the money you invest. This is a high-risk investment and you are unlikely to be protected if something goes wrong. Take 2 minutes to learn more
Litecoin Price Prediction – March 12
The positional stances of long-position placers have been somewhat exhausted to make the financial situation between Litecoin trade versus the valuation of the US Dollar now reverses around $100, opting for recoups.
The market is trading at a negative average percentage rate of 6.94 roughly around the point of $96.63. Since there has been a falling force, the attempted move will short survive in a way that creates a feasible rallying movement if a rebounding motion is created along the line.
LTC/USD Market
Key Levels:
Resistance levels: $110, $120, $130
Support levels:$85, $80, $75
LTC/USD – Daily Chart
The LTC/USD daily chart reveals that the crypto trade reverses at $100, opting for recoups alongside the yesterday’s bullish candlestick.
The Bollinger Band trend lines are slightly northwardly. The middle Bollinger Band indicator remains the crucial support trade zone around the point of $80. The stochastic oscillators have started moving slowly sown to touch a point near the line of 20.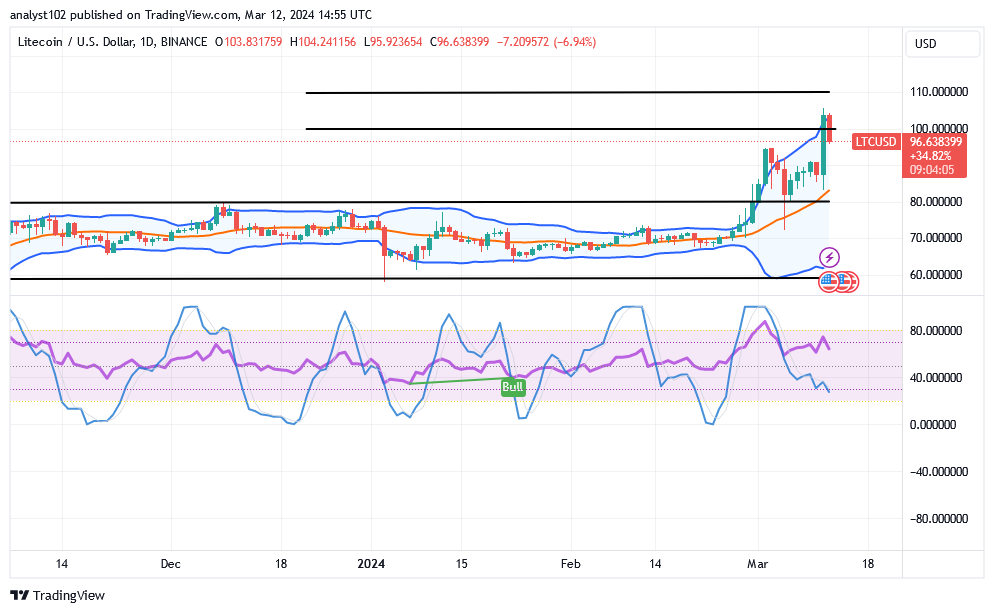
If bears must be, in which direction does the LTC/USD market often move below?
A horizontal line has been drawn around $110, indicating that a firm barrier trade spot underneath which the bears will have to play, given that the LTC/USD price reverses at $100, opting for recoups.
The repositioning stochastic oscillators are approaching an ideal lower level to compose momentum to create a crypto signal to support a move back to the upside. It would be a good moment for long-position pushers to launch back a buy order.
Emphasis has to be on the positioning of the stochastic oscillators by being patient toward letting them be around higher resistance spots around the horizontal line of $110. In the event of pushing southbound to the downside, sellers should be cautious of moving alongside any liable force to oppose furthering of rises.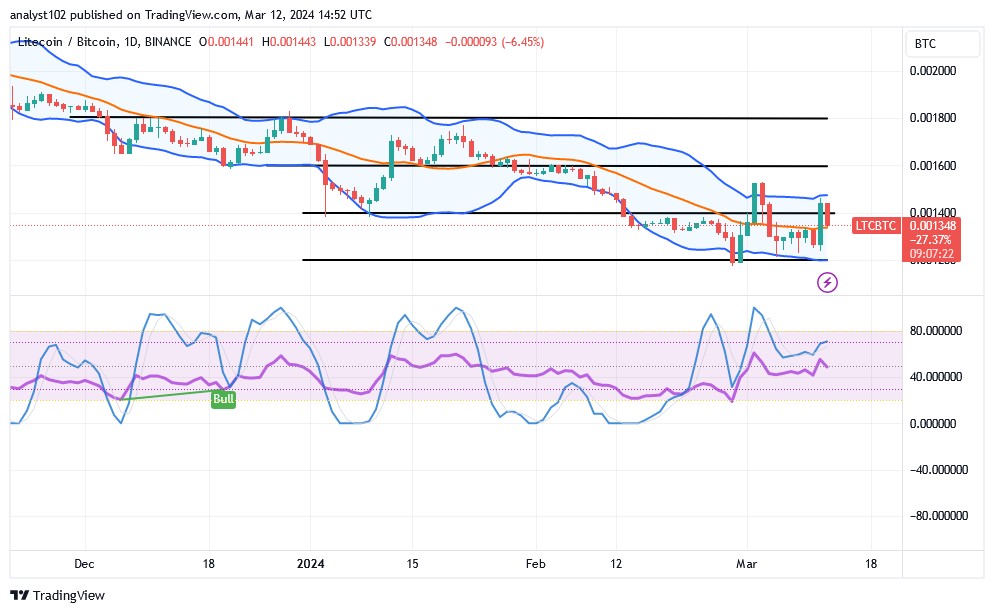
LTC/BTC Price Analysis
In contrast, the Litecoin market reverses around the upper Bollinger Band versus Bitcoin, opting for recoups.
There has been an entative movement of the stochastic oscillators towards the north rather than the south. The Bollinger Band trend lines are still placed to the south with a baseline that has been forming around the lower Bollinger A bearish trending force has been established to denote that buyers need to be cautious of making comebacks.
Note: Cryptosignals.org is not a financial advisor. Do your research before investing your funds in any financial asset or presented product or event. We are not responsible for your investing results.
You can purchase Lucky Block here. Buy LBLOCK