Litecoin (LTC/USD) Price Steps Down, Attempting a Footstep
Estimated Reading Time: 3 minutes
Don’t invest unless you’re prepared to lose all the money you invest. This is a high-risk investment and you are unlikely to be protected if something goes wrong. Take 2 minutes to learn more
Litecoin Price Prediction – March 19
Activities that are exerting an intense force on the operations of the LTC/USD trade have now led to a situation where the price steps down, attempting a footstep.
The cryptocurrency market has produced bullish candlesticks over the past two days, despite the fact that it is still maintaining a negative exchange line of almost $83. Based on those technical considerations, the market is most likely to engage in a pause before picking up speed again. Investors are expected to adhere to the long-term running principle of securing and holding the base instrument against its fiat counterpart.
LTC/USD Market
Key Levels:
Resistance levels: $95, $105, $115
Support levels:$75, $70, $65
LTC/USD – Daily Chart
The LTC/USD daily chart reveals that the crypto-economic market steps down, attempting a footstep from the buy signal side of the lower Bollinger Band.
After crossing into the oversold area to the south, the stochastic oscillators have produced a crypto signal that could indicate risky entry points for additional down. The lower-end Bollinger Band trend lines are indicating the key zone, or $75 or so, where a downward break will force bears to retreat and delay their arrival until later.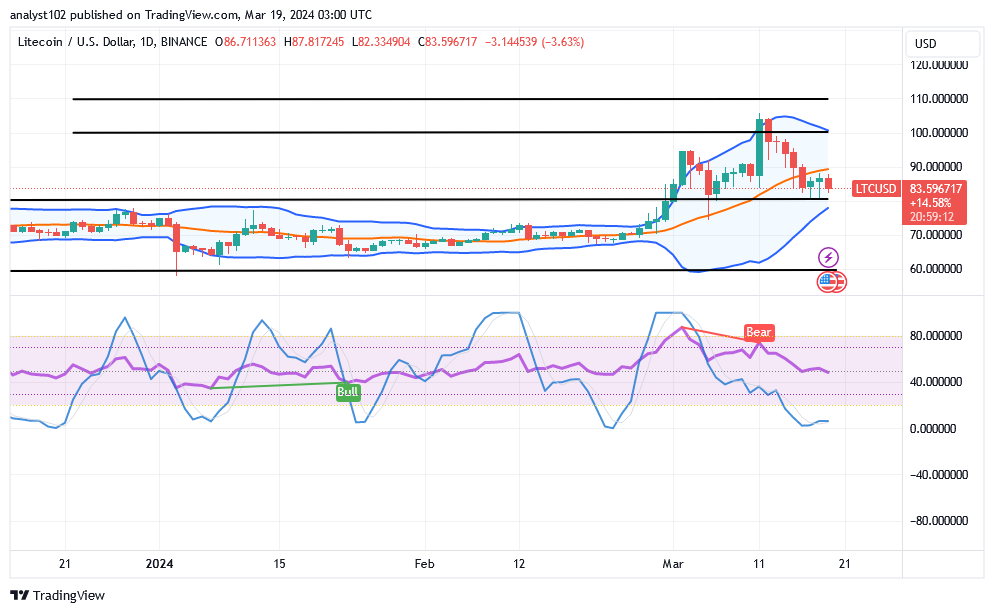
Given that most cryptocurrency economies have lately seen bullish moves, should buyers of LTC/USD trades be afraid to take advantage of current declines in price?
It has been a bullish trading trend that has gradually returned to the market. Long-position placers are to be strategic by making several dip buying orders, given that the LTC/USD market steps down, attempting a footstep.
It would be wise for bulls to take advantage of any moves that will result in an aggressive outcome, particularly if the price is unable to consistently decline past the lower Bollinger Band signal, given that the market’s trade point has been observed attempting to make major upswings over the past two days. Investors ought to hold onto their positions even tighter.
As long as the price does not break over the $95 resistance’s trade zones, the shorting order process may continue to yield gains. Price movements to the south that are inclined to compress against the lower Bollinger Band might not be able to sustain the forces needed to produce long-term falls.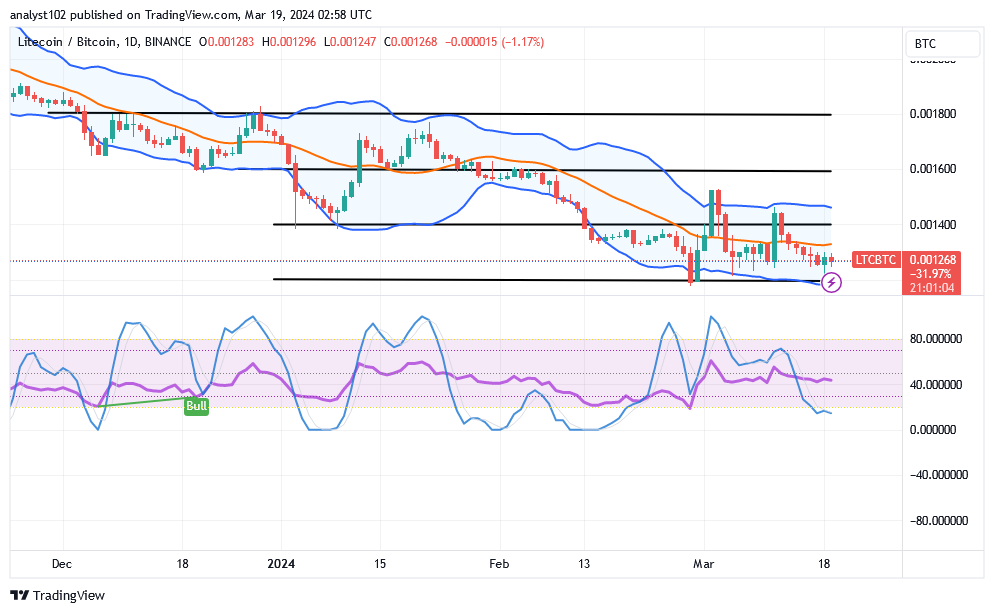
LTC/BTC Price Analysis
In contrast, the Litecoin market steps down versus the purchasing ability of Bitcoin, attempting a footstep formation near the lower Bollinger Band.
The stochastic oscillators’ placement in the oversold area indicates that further fall-offs are unlikely to occur in the near future. The trend lines of the Bollinger Band are drawn, defining significantly larger openings to the east. Stated differently, it indicates that certain lower locations have been designated as range-bound zones. The base mystery still seems to be gaining pace at this point.
Note: Cryptosignals.org is not a financial advisor. Do your research before investing your funds in any financial asset or presented product or event. We are not responsible for your investing results.
You can purchase Lucky Block here. Buy LBLOCK