Ethereum (ETH) Battles the Resistance at $2,859, Uptrend Likely
Estimated Reading Time: 2 minutes
Don’t invest unless you’re prepared to lose all the money you invest. This is a high-risk investment and you are unlikely to be protected if something goes wrong. Take 2 minutes to learn more

Ethereum Price Long-Term Analysis: Bullish
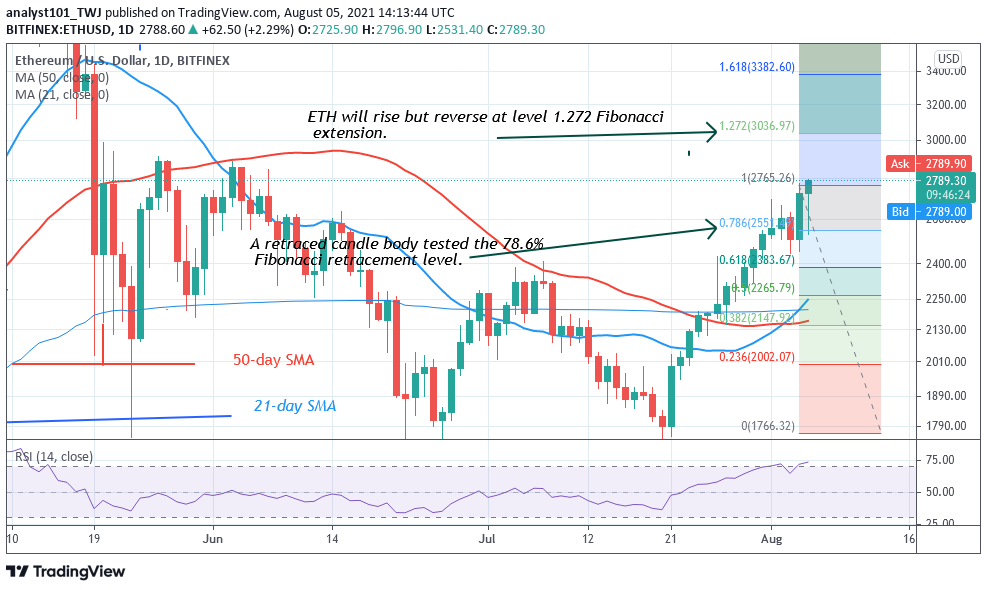
Today, Ether’s price has rallied to $2,780 after its retracement to the low of $2,446.90. The current bullish momentum is likely to extend to the previous highs. Yesterday, Ether’s price broke the resistance at $2,632 as the biggest altcoin approached the next resistance at level $2,859. Meanwhile, on August 1 uptrend; a retraced candle body tested the 78.6% Fibonacci retracement level. The retracement indicates that ETH is likely to rise to level 1.272 Fibonacci extension or level $3,036.97.
Ethereum Indicator Analysis
Ether is at level 73 of the Relative Strength Index period 14. It indicates that the altcoin has reached the overbought region of the market. Ether is likely to resume a downward move. It is above the 72% range of the daily stochastic. The biggest altcoin has reached the overbought region of the market. Ether is in the bullish trend zone as price bars are above the 21-day and the 50-day SMA. The upward move is doubtful as the market reaches the overbought region of the market.
Technical indicators:
Major Resistance Levels – $2, 600, $2,800, $3,000
Major Support Levels – $1.500, $1, 300, $1,100
What Is the Next Direction for Ethereum?
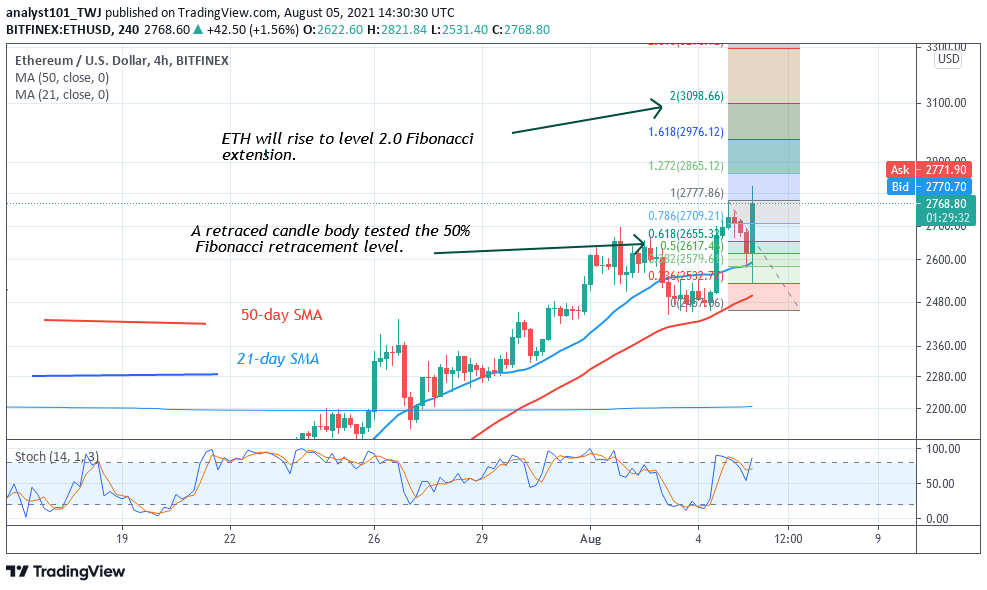
Ethereum is in a strong bullish momentum as the market approaches a new high of $2,800. Meanwhile, on August 4 uptrend; a retraced candle body tested the 50% Fibonacci retracement level. The retracement indicates that ETH is likely to rise to level 2.0 Fibonacci extension or level $3,098.66.
You can purchase crypto coins here. Buy Token
Note: Cryptosignals.org is not a financial advisor. Do your research before investing your funds in any financial asset or presented product or event. We are not responsible for your investing results