Uniswap (UNI/USD) Market Pushes Lower Closer to $16
Estimated Reading Time: 3 minutes
Don’t invest unless you’re prepared to lose all the money you invest. This is a high-risk investment and you are unlikely to be protected if something goes wrong. Take 2 minutes to learn more
Uniswap Price Prediction – January 6
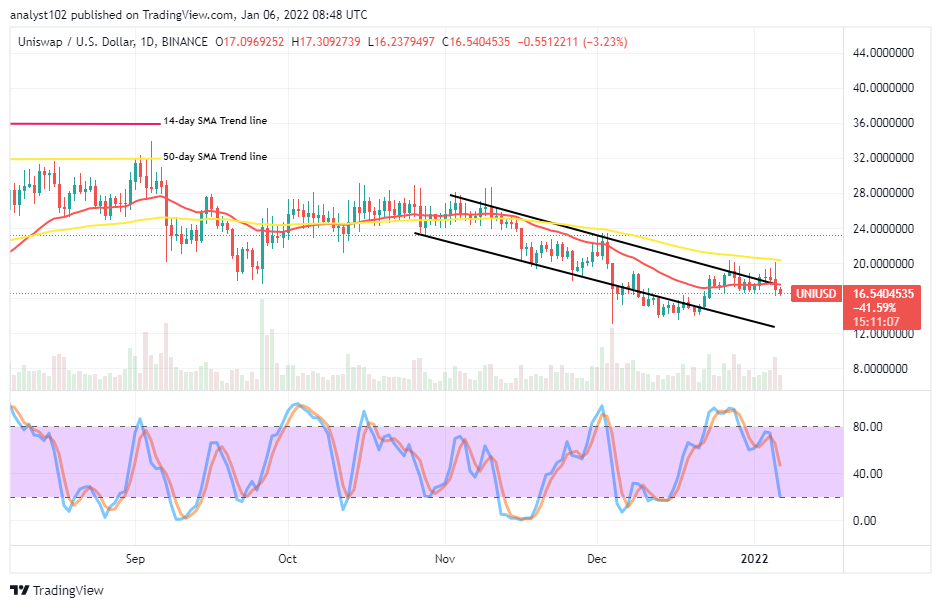
The UNI/USD trade operations have been on a declining posture as the crypto-economic market pushes lower closer to $16. There has been an in-active motion in today’s activities as the price is around d the same value line at a negative percentage rate of 3.23.
UNI/USD Market
Key Levels:
Resistance levels: $18, $22, $26
Support levels: $12, $10,$8
UNI/USD – Daily Chart
The UNI/USD daily chart showcases that the crypto-economic market pushes lower closer to $16. A smaller bearish candlestick is emerging on a lesser-moving motion against the trend line of the smaller SMA. The 50-day SMA indicator is above the 14-day SMA indicator. The upper correction channel trend line drew to touch the smallerSMA indicator. The Stochastic Oscillators are swerving the lines slowly toward the range of 20. That signifies that the crypto may lose momentum more for a while.
Will the UNI/BTC trade lose more momentums as the crypto market pushes lower closer to $16?
The downward depression presently on the UNI/BTC trade operation is still on a high note to let the crypto’s price continue to fall for a while as the market pushes lower closer to the $16 trading level. It may be a while before the market gets a stance to swing up. The previous low-value line around $14 could breach downward past in the subsequent sessions. The $14 and the $12 support levels are possibly going to be the end of the current falling forces to let bulls find a stance to get re-energized afterward.
On the downside of technical analysis, the UNI/BTC market, may in the meantime, stay surrendering to descending forces under the major resistance trading line at $20. A more visibly sudden breakdown at $16 may let the price go lowering for a consolidation moving style around $14 and $12 levels based on a long-term basis. In the aftermath of those presumptions playing out, less-active motions are liable to dominate the trading stances of the crypto economy.
UNI/BTC Price Analysis
In comparison, despite a sign that Uniswap is rallying against Bitcoin on the price analysis chart, the base crypto still looks moving under a depressive setting at the upper bearish trend line. The 14-day SMA indicator is underneath the 50-day SMA indicator, slightly bending northward closely below it. The Stochastic Oscillators are in the overbought region swinging within to indicate the base crypto coin has the likelihood of losing the stances to the counter-trading crypto in the near time.
Note: Cryptosignals.org is not a financial advisor. Do your research before investing your funds in any financial asset or presented product or event. We are not responsible for your investing results.
You can purchase crypto coins here. Buy Tokens