Ethereum (ETH/USDT) Eyes a Relief Rally Amid Market Pressure
Estimated Reading Time: 3 minutes
Don’t invest unless you’re prepared to lose all the money you invest. This is a high-risk investment and you are unlikely to be protected if something goes wrong. Take 2 minutes to learn more
Ethereum Long-term Analysis: Bullish
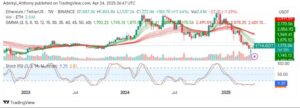
The market for Ethereum against the Tether has been in a steep downtrend since peaking above $2,500 at the beginning of the year. However, the current surge in price suggests a bullish bounce as the indicators show signs of recovery from the oversold region.
Recently, Ethereum weekly volume has shown a notable increase, forming a slight uptick. This suggests buyers are returning with support close to $1,702.22.
Currently, Ethereum trades at $1,772.06, recording more than 11% gain with over 2 million traded volumes.
Technical Indicators
Major Resistance Levels: $1,875.57, $1,969.41, and $2,056.00
Major Support Levels: $1,702.22, $1,537.00, and $1,400.00
Ethereum Technical Analysis
The analysis of Ethereum against the Tether on a weekly chart shows signs the pair’s price is about to claim the lower bound of the Guppy Multiple Moving Averages (GMMAs), suggesting a potential inflection point. However, more bullish power is needed for the formation of a bullish structure.
On the other hand, the Stochastic RSI has signaled a bullish crossover from an oversold region, indicating a potential upside movement as the pair holds above $1,702 support levels.
To this end, the pair shows signs of early bullish divergence under critical moving averages; a weekly close above $1,875.57 would indicate a potential breakout from the bearish structure; otherwise, an outplay of the continued trend might be seen.
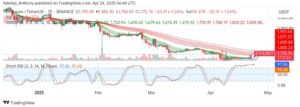
ETH/USDT Analysis: A Dead Cat Bounce or the Start of a Reversal?
On the daily timeframe, ETH/USDT appears to have reclaimed a position above $1,750 as the Stochastic oscillator signals a deeply overbought situation. However, the blue line reads 97.06, indicating a strong momentum and the possibility of a near-term pullback.
From another angle, the market structure remains bearish as the GMMAs tend southeast. However, with increased volume, a break above $1,803 in the near term would establish a convincing move to the north.
To this end, with overbought flattened lines of the Stochastic RSI, the pair might see a price dip before a move to the top.
You can purchase crypto coins here. Buy LBlock