The Sui Market (SUI/USD) Maintains Upward Momentum Following $1.20 Breakout
Estimated Reading Time: 3 minutes
Don’t invest unless you’re prepared to lose all the money you invest. This is a high-risk investment and you are unlikely to be protected if something goes wrong. Take 2 minutes to learn more

The Sui market has sustained a significant uptrend following its decisive breach of the $1.20 price level. While the market encountered minor resistance at the $1.300 mark, it has demonstrated resilience and continued its upward trajectory.
Previous analyses had suggested a potential correction or even a bearish trend due to concerns about overbought market conditions. However, the ongoing bullish momentum indicates that there may still be room for further upsides in the crypto signal.
To gain a deeper understanding of the market’s current state and potential future direction, let’s examine the insights provided by technical indicators.
The Sui Market Data
- SUI/USD Price Now: $1.50
- SUI/USD Market Cap: $ 4 billion
- SUI/USD Circulating Supply: 2.7 billion
- SUI/USD Total Supply: 10 billion
- SUI/USD CoinMarketCap Ranking: #24
Key Levels
- Resistance: $1.600, $1.700, and $1.800
- Support: $1.400, $0.300, and $0.200.
The Sui Market Through the Lens of Indicators
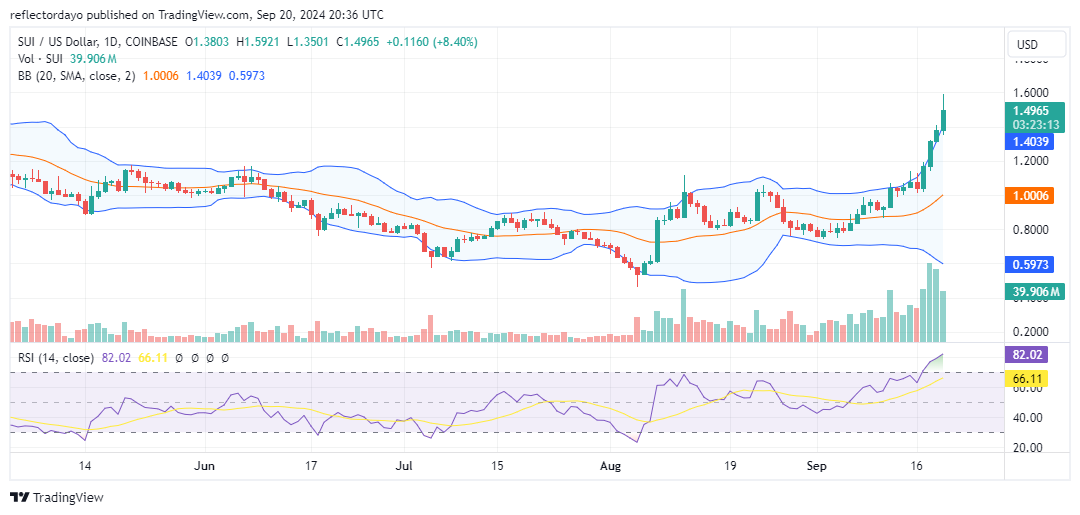
In our previous analysis of the Sui market, we highlighted the significance of trading volume. The substantial increase in volume indicated a strong bullish bias, suggesting that the uptrend might continue. However, the market’s prolonged overbought condition, as evidenced by both the Bollinger Bands and Relative Strength Index, suggests a potential for a correction or reversal.
New investors should exercise caution as the market’s current state makes it susceptible to significant price fluctuations. While the Bollinger Bands have diverged, indicating increased volatility, the strong bullish momentum has pushed the price above major resistance levels like $1.300 and $1.500.
The recent price peak at $1.600 has been followed by a notable downward correction. Today’s candlestick with a substantial upper shadow suggests potential profit-taking or selling pressure.
It is advisable for investors to wait for the market to stabilize around the $1.400 level, converting it into a support zone, and for market indicators to become more supportive before entering new positions. Despite the current bullish trend, there remains a risk of a significant price correction.
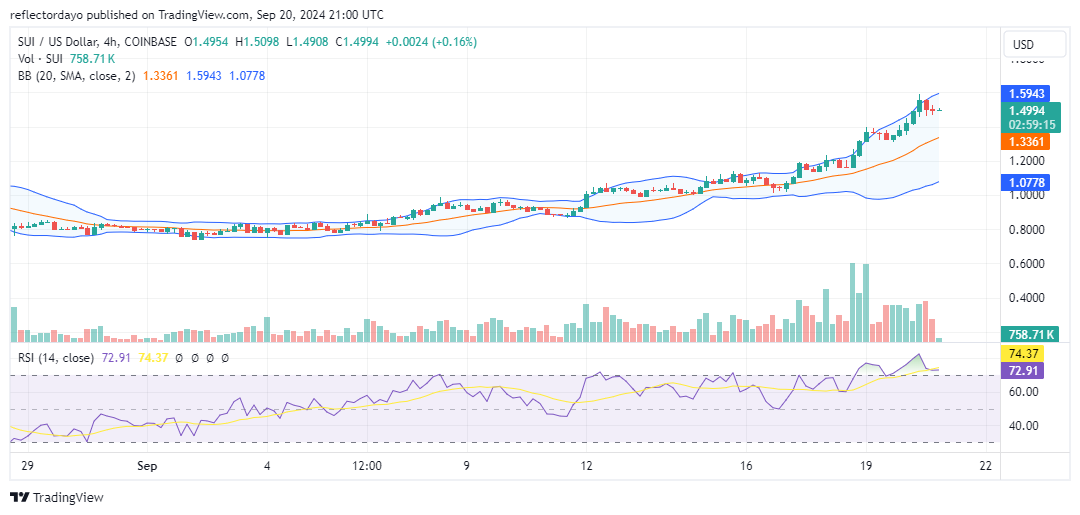
SUI/USD Price Prediction: 4-Hour Chart Analysis
While the 4-hour chart outlook may appear less volatile due to the narrower Bollinger Bands, the overall market environment suggests a potential for a correction. The market has been consistently rising, providing opportunities for new investors to enter. However, several indicators suggest that a reversal may be imminent.
The Relative Strength Index (RSI) has remained persistently in the overbought territory for an extended period, indicating that the market may be reaching a peak. Additionally, a decline in trading volume and a widening of the Bollinger Bands suggest increasing volatility and a potential reversal.
While the short-term trend remains bullish, investors should be cautious and prepared for a potential correction.