The Sui Market (SUI/USD) Breaks Above the $1.20
Estimated Reading Time: 3 minutes
Don’t invest unless you’re prepared to lose all the money you invest. This is a high-risk investment and you are unlikely to be protected if something goes wrong. Take 2 minutes to learn more

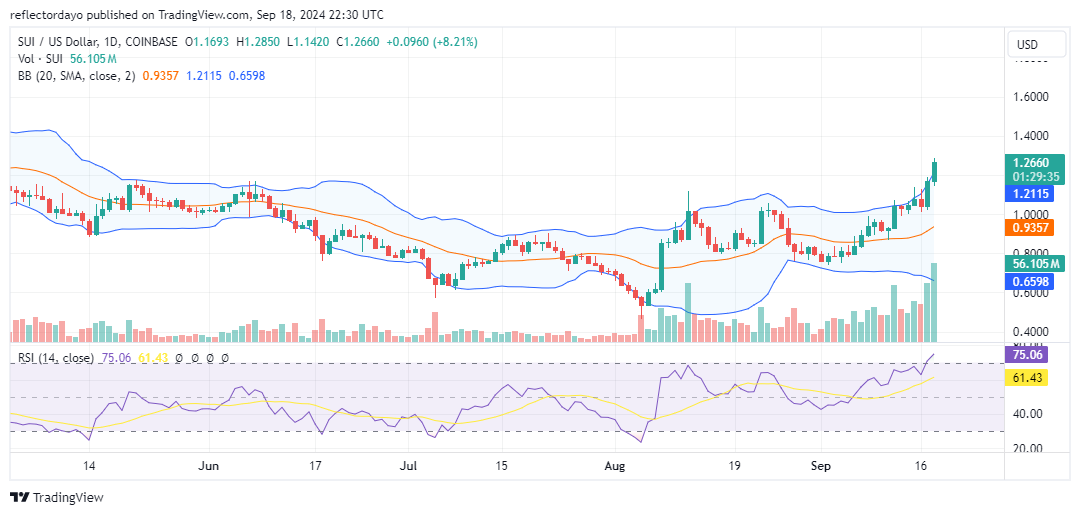
In a significant development, the Sui market has successfully breached the crucial $1.20 price level. Previous analysis had indicated a potential slowdown as the market approached this critical resistance point, with some traders anticipating a correction. However, the recent crypto signal from the daily chart reveals a clear breakout above $1.20, suggesting a shift in market sentiment.
To gain a deeper understanding of the Sui market, let’s examine the insights provided by technical indicators.
The Sui Market Data
- SUI/USD Price Now: $1.27
- SUI/USD Market Cap: $ 3.4 billion
- SUI/USD Circulating Supply: 2.7 billion
- SUI/USD Total Supply: 10 billion
- SUI/USD CoinMarketCap Ranking: #25
Key Levels
- Resistance: $1.300, $1.400, and $1.500
- Support: $1.000, $0.900, and $0.800.
The Sui Market Through the Lens of Indicators
Technical analysis initially suggested a potential correction in the Sui market. The Bollinger Bands indicator indicated overbought conditions, with the price extending beyond the upper standard deviation and diverging bands. Additionally, the Relative Strength Index (RSI) had breached the 70 level, further supporting the possibility of a correction.
However, contrary to expectations, the market has successfully broken through the $1.20 price level and continued its upward trajectory. The volume indicator, on the other hand, has shown a significant increase in trading activity, suggesting strong interest from both buyers and sellers.
The recent breakout above $1.20 indicates a shift in market sentiment, with bullish forces gaining momentum. If the market were to experience a correction from these higher levels, the $1.20 price level could potentially act as a support level, helping to maintain an upward bias.
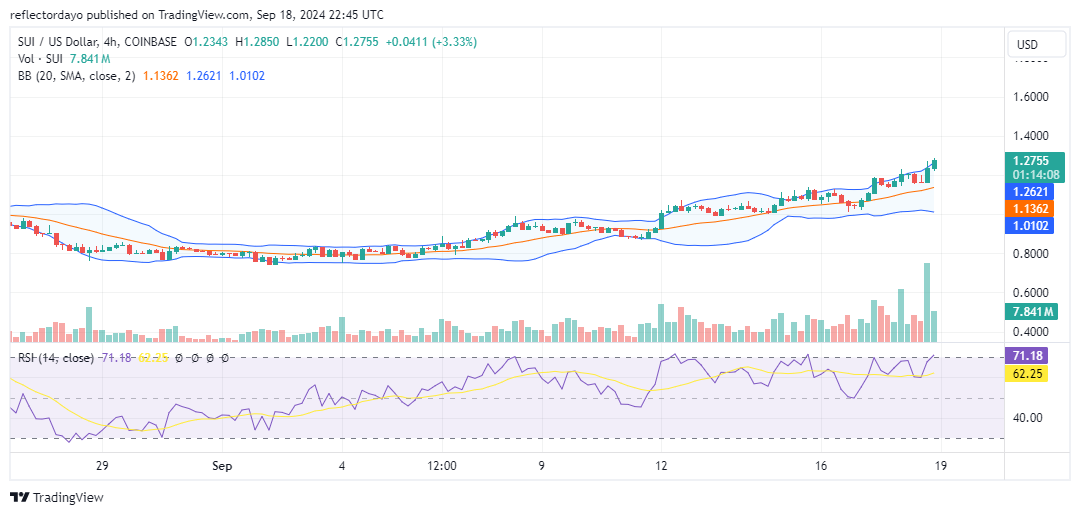
SUI/USD Price Prediction: 4-Hour Chart Analysis
The 4-hour chart continues to showcase a strong uptrend, with the price consistently trading above the 20-day moving average. In previous analysis, we identified the $1.20 level as a significant resistance point, as the price repeatedly faced rejection at this level. However, the market has recently achieved a breakout above this resistance, triggering increased optimism among traders and driving the price higher.
Despite the positive momentum, a new resistance level is now emerging at $1.28. If bullish forces are unable to overcome this obstacle, the $1.20 level could potentially act as a support, limiting further downside.