Retracement Abounds on Synthetix (SNXUSD) to Gain Momentum for New Impulsive Moves
Estimated Reading Time: 3 minutes
Don’t invest unless you’re prepared to lose all the money you invest. This is a high-risk investment and you are unlikely to be protected if something goes wrong. Take 2 minutes to learn more

Free Crypto Signals Channel
Market Analysis: SNXUSD Retracement Abounds to Gain Momentum for New Impulsive Moves
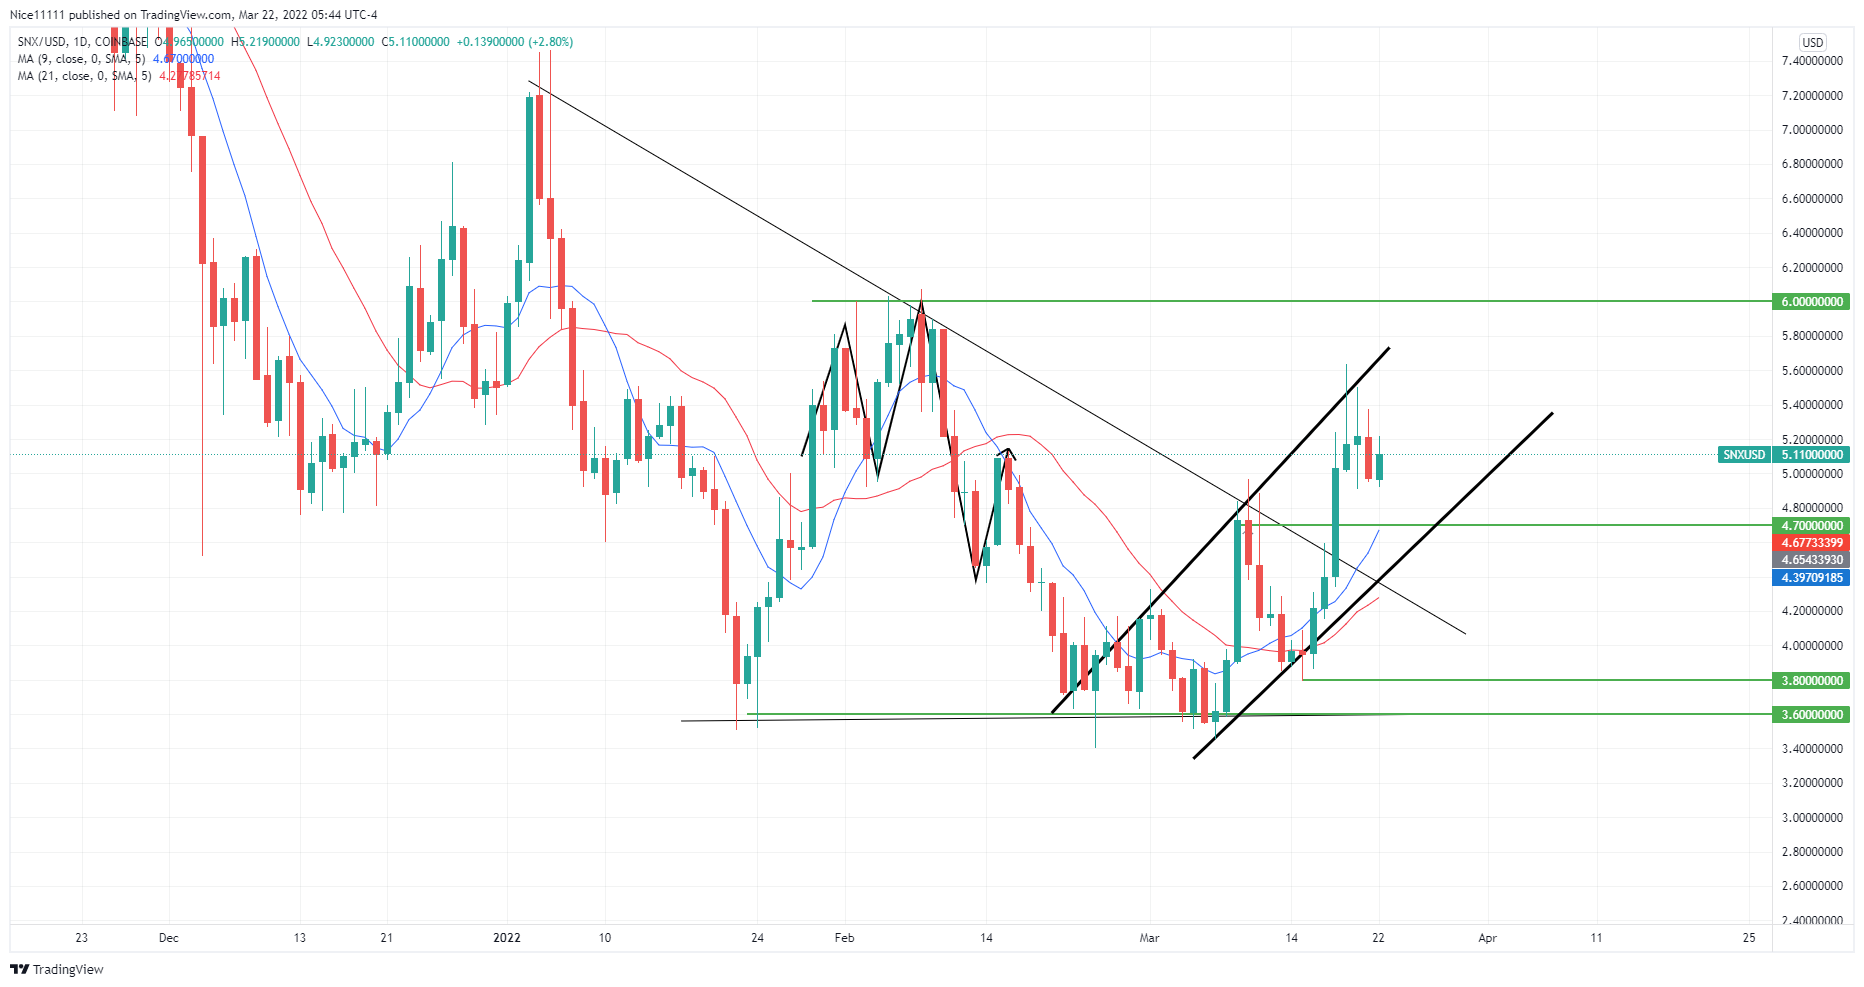
Retracement abounds on SNXUSD to gain momentum for new impulsive moves. The demand zone at $3.60 was heavily defended as it was tested three times, but there was a failure to surpass the zone. This created equal lows in the market space. As seen in the higher timeframe, the bulls failed to make new highs as the lows held in the market. Lower highs were formed after previous highs in the market. This started a downward slope in the price. The daily chart presented a falling triangle pattern for traders.
Major Zones on SNXUSD
Resistance Zone: $6.00, $4.70
Supply Zones: $3.80, $3.60
On February 24th, the demand zone at $3.60 was formed. There was a false breakout beneath the zone. The market immediately bounced off the critical level. The market formed a high on the 1st of March. The high was created with an indecision candle. The market fell back to the demand zone at $3.60 to gain momentum for new impulsive moves. Upon reaching the demand zone, the bulls regained strength and pumped the price rapidly. The size of the bullish candle on the 9th of March revealed the impulsiveness of the bulls.
Multiple shadows formed above the daily candles at $4.70. A retracement followed this on SNXUSD to gain momentum for new impulsive moves. The retracement dipped to $3.80. An indecision candle struck the $4.70 level. This was followed by three white soldiers that broke out of the descending triangle pattern. At the point of touching the $3.80 level, an ascending channel was created. The displacement in the market rose to form the third touch of the upper border in the ascending channel.

What to Expect From SNXUSD?
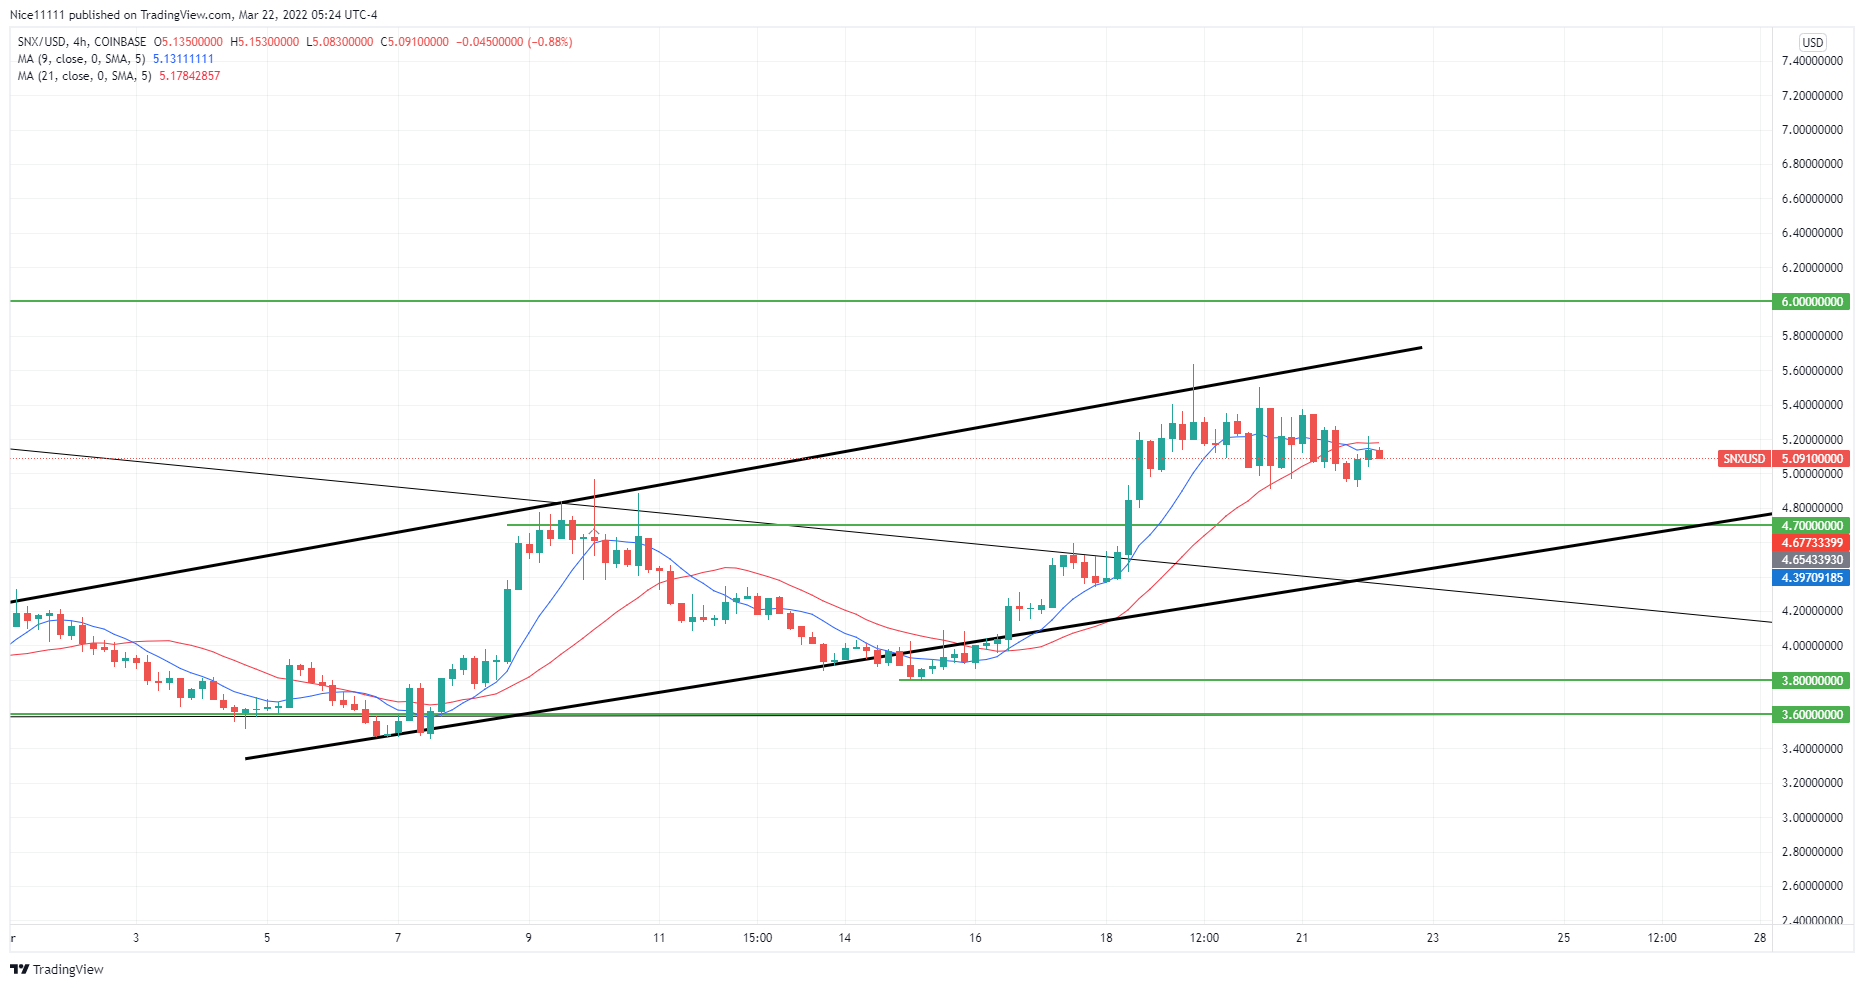
Currently, retracement abounds on SNXUSD to gain momentum for new impulsive moves. The bullish move steadily gyrates towards the previous resistance zone at $4.70. The resistance zone is expected to hold prices to seek higher bullish prices. The Moving Averages cross each other on the 11th of March to signify a bullish price on the daily timeframe. The MA period nine has crossed the MA period twenty-one to the downside on the four-hour chart. This is currently creating a lower timeframe reversal. This is expected to facilitate the retracement to $4.70 and gain momentum in the market.
How To Buy Lucky Block
Note: Cryptosignals.org is not a financial advisor. Do your research before investing your funds in any financial asset or presented product or event. We are not responsible for your investing results.