Polygon (POL) Price Prediction: SOL/USDT Stays Relatively Boring
Estimated Reading Time: 3 minutes
Don’t invest unless you’re prepared to lose all the money you invest. This is a high-risk investment and you are unlikely to be protected if something goes wrong. Take 2 minutes to learn more
Polygon (POL) Price Prediction: July 27
Price movement in the Polygon daily market has continued to oscillate just above the $0.5000 threshold. The market has risen past some important technical landmarks in the previous session. However, upside momentum has failed to gather significant price increases since then.
POL/USDT Long-term Trend: Bullish (Daily Chart)
Key Price Levels:
Resistance Levels: $0.5500, $0.6000, and $0.7000
Support Levels: $0.5000, $0.4000, and $0.3000
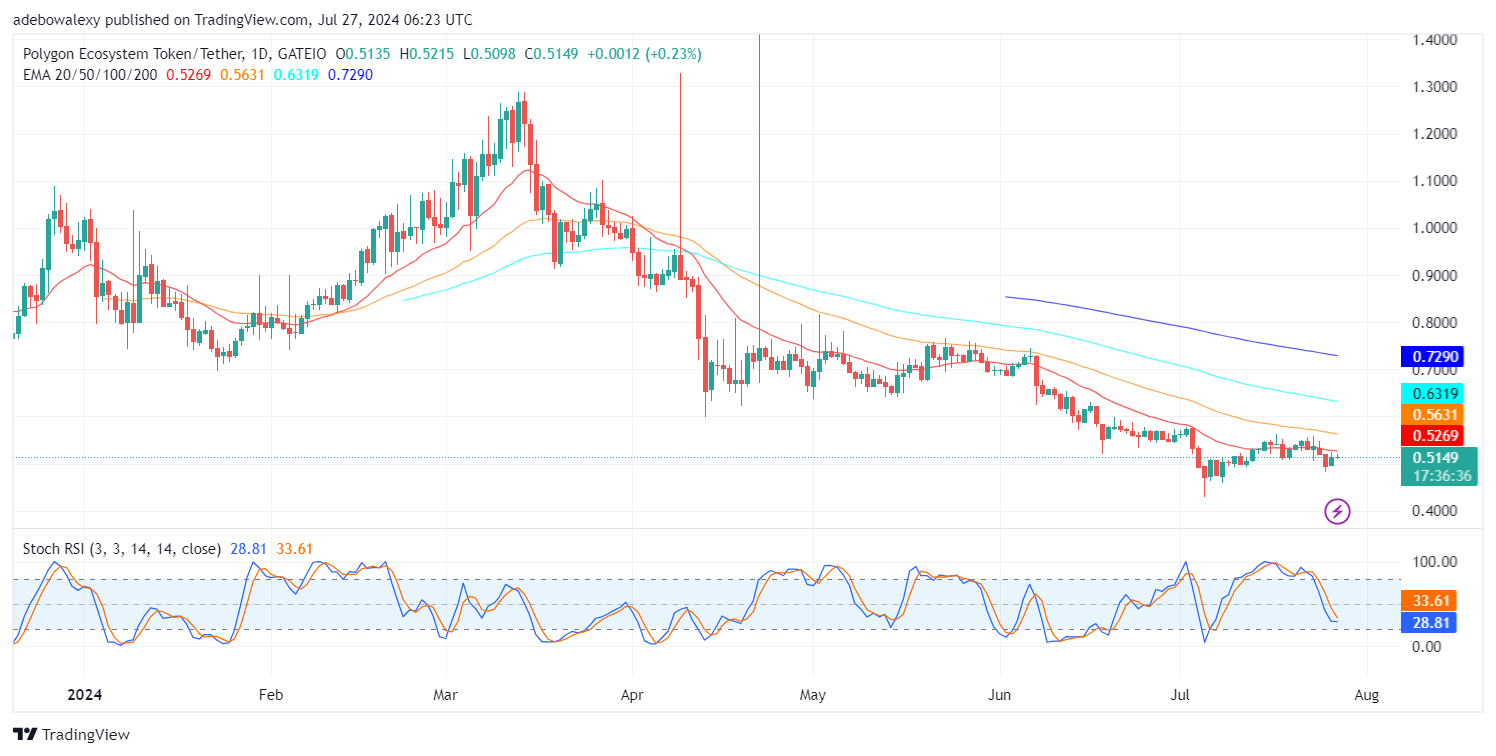
About three sessions ago, price action retreated below the 20-day Exponential Moving Average (EMA) line. The market showed resilience to stay above the $0.5000 threshold in the previous session. However, judging by the appearance of the last price candle on this chart, we can see that the current session still lacks significant participation. Nevertheless, the Stochastic Relative Strength Index (SRSI) lines can still be seen approaching an upside crossover below the 40 mark of the indicator.
Polygon Price Prediction: POL/USDT Market Still Faces Opposition Below the 20-Day EMA
The price candle representing the ongoing session in the Polygon market can be seen as having a very tiny body size. The appearance of an upper shadow above this price candle suggests that it has been compressed by downward forces. This is happening while price action still lies below the 20-day EMA curve and therefore below all the EMA lines.
However, the SRSI indicator lines can still be seen approaching an upside crossover. This rekindles hopes of a possible upside correction through the 20-day EMA curve.
POL/USDT Medium-term Trend: Polygon’s Price Action Continues to Hug the 20-Day EMA Line (4H Chart)
In recent trading sessions, it can be seen that price movement has dwelled mostly around the 20-day EMA curve. Also, the upper shadow of these price candles can be seen, showing that the 50-day EMA line has been a strong resistance. This opinion emanates from the fact that the market has contracted downward after hitting that line. The last price candle here still appears green but below the 20-day EMA. Meanwhile, the SRSI indicator lines can be seen rising still into the overbought region.
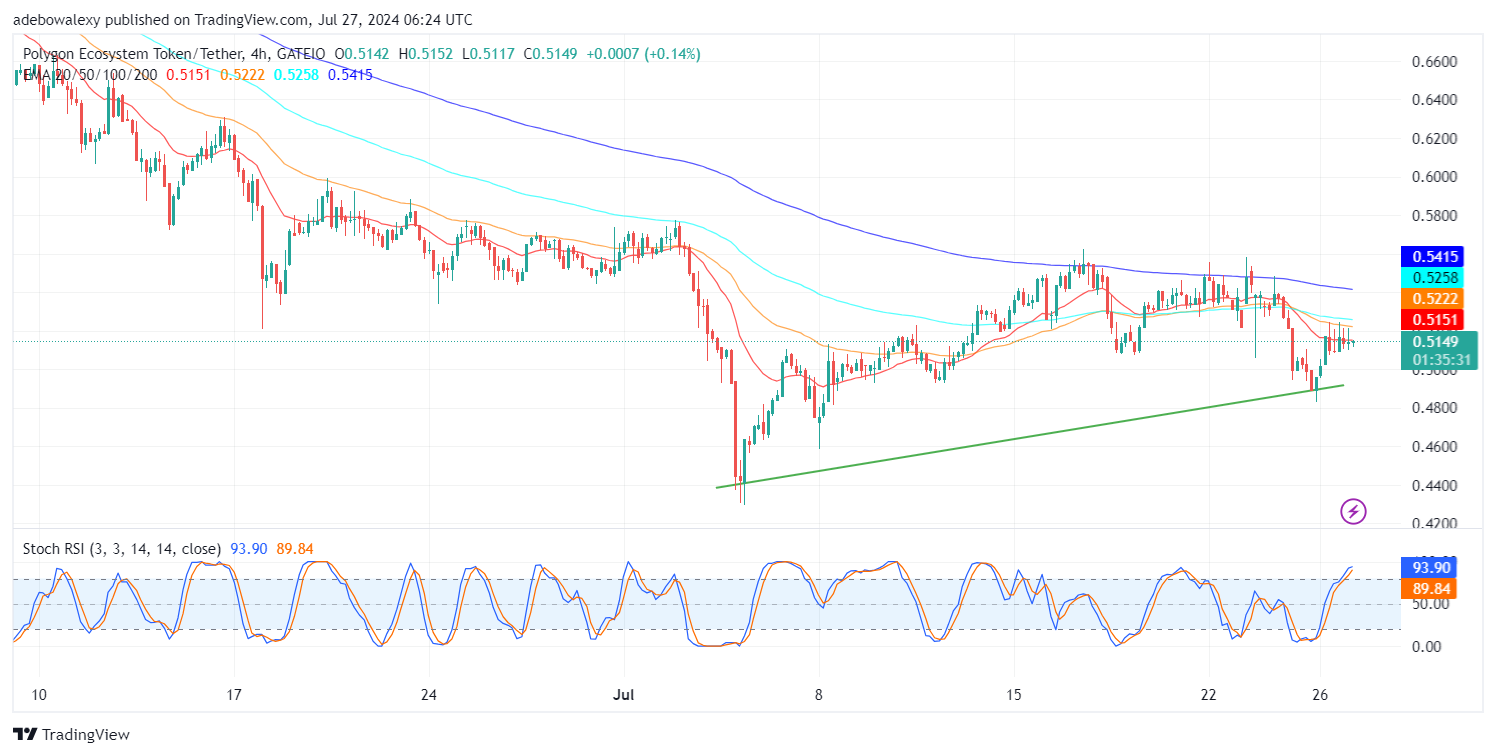
Technically, we may not expect to see much price movement in this market. Nevertheless, traders may place an entry above the $0.5222 price level, as a price increase past this level may secure more upside moves. However, a continued downward correction towards the $0.4500 mark still seems possible.